
Photo: David Foote / AUSPIC / DPS (CC BY 4.0)
On 16 August 2023, Anthony Albanese's National Cabinet made an ambitious commitment: Australia would build 1.2 million new homes by June 2029. That's the centrepiece of the National Housing Accord. The math seems straightforward—1.2 million homes over five years equals 240,000 per year. But Australia has never hit 240,000 completions in any year on record. What does the data actually show about whether this target is within reach?
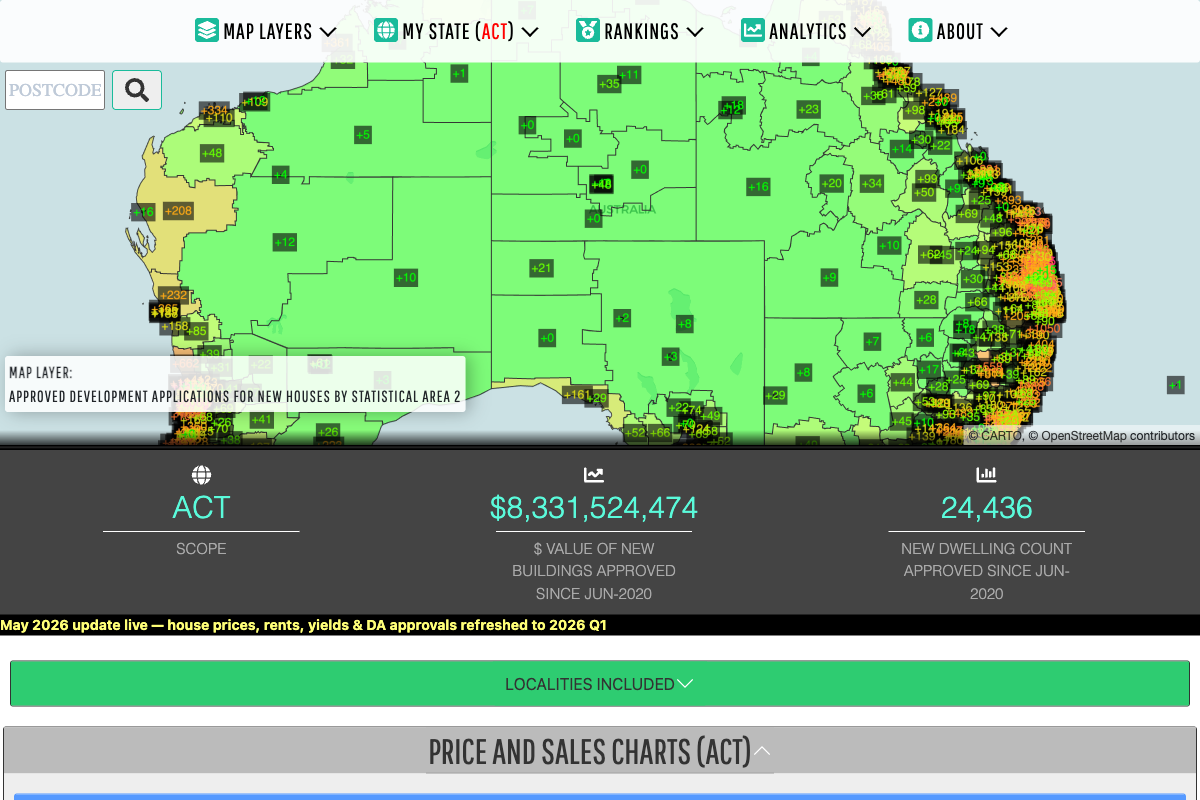
To find out, we pulled the latest ABS building approval data directly from the heatmaps.com.au map. The results tell a sobering story about the gap between ambition and reality.
What the Approval Pipeline Shows
First, a clarification: the data we're looking at is development approvals (DAs)—not completed homes. When a local council approves a new development, that counts as an "approval." But approvals don't instantly turn into finished houses. From approval to completion typically takes 12–24 months, and not all approved projects ever get built. So the approval count is a leading indicator of the pipeline—what might be built next—not what has been built now.
From June 2020 to Q1 2026, Australian councils approved 1,056,669 new dwellings across all states. That's a span of about 5.75 years, giving us an average approval rate of approximately 183,770 per year. The government's target requires 240,000 per year—a jump of 31% above current run-rates. This total includes houses, flats/units, and townhouses — all three dwelling types tracked by ABS building approval data.
State-by-State Breakdown: Who's Building What
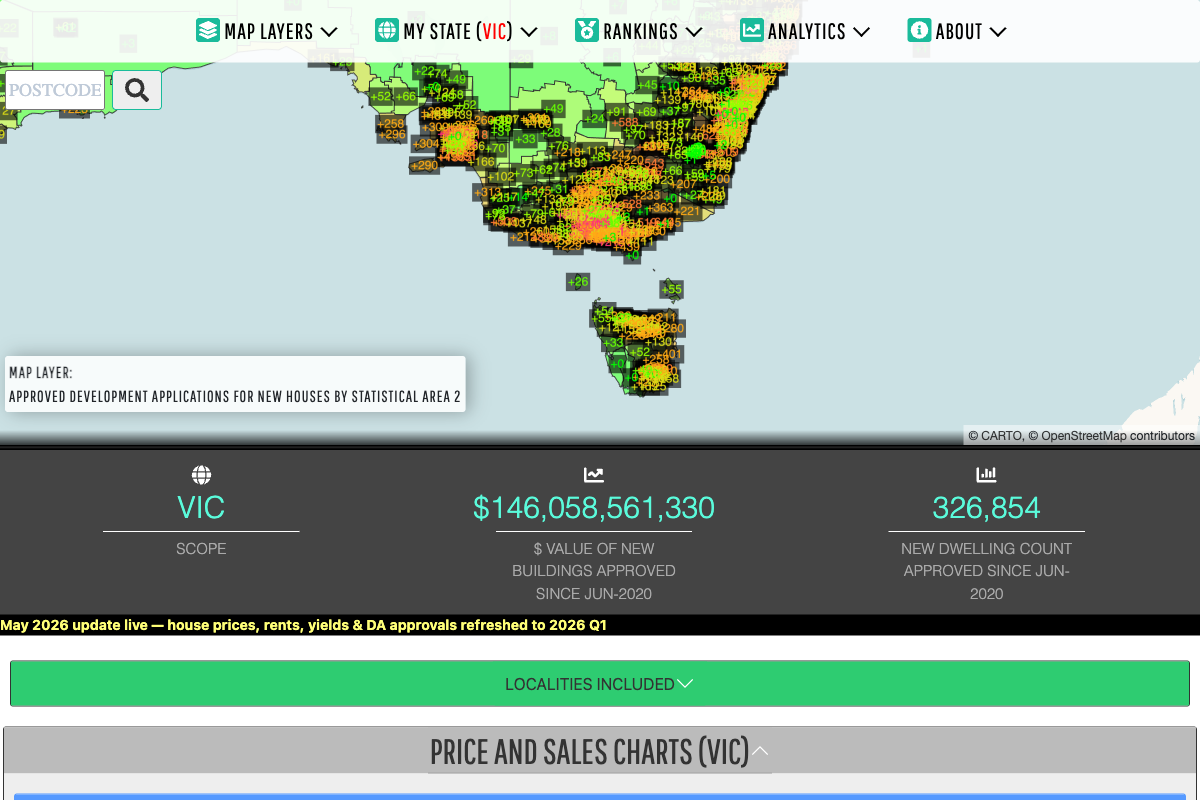
The national figure masks huge state-by-state variation. Victoria has been Australia's construction powerhouse, accounting for nearly a third of all approvals since 2020. New South Wales is a close second. But some states are barely participating in the national housing boom.
| State | Houses | Units | Townhouses | Total | Total Value | Avg New House Value |
|---|---|---|---|---|---|---|
| VIC | 208,352 | 57,382 | 61,120 | 326,854 | $146.1B | $442.6k |
| NSW | 143,954 | 83,282 | 59,895 | 287,131 | $130.9B | $468.3k |
| QLD | 137,707 | 47,606 | 28,499 | 213,812 | $98.1B | $427.8k |
| WA | 95,493 | 11,083 | 6,144 | 112,720 | $44.6B | $382.4k |
| SA | 56,243 | 5,159 | 11,328 | 72,730 | $25.8B | $350.3k |
| ACT | 5,948 | 14,133 | 4,355 | 24,436 | $8.3B | $403.2k |
| TAS | 15,433 | 393 | 557 | 16,383 | $6.0B | $370.2k |
| NT | 2,250 | 95 | 258 | 2,603 | $1.1B | $440.4k |
| TOTAL | 665,380 | 219,135 | 172,154 | 1,056,669 | $460.8B | $427.1k |
Data: ABS building approvals (houses, units & townhouses) since June 2020, updated Q1 2026. "Avg New House Value" = average approved construction value per new house, derived from total house approvals ÷ total houses. Source: heatmaps.com.au
The breakdown by dwelling type reveals distinct regional patterns. Victoria leads on house approvals (208,352 houses, 63.7% of its total), while NSW builds proportionally more units (83,282 units = 29% of NSW's total). The ACT is an outlier, with units dominating at 57.9% of approvals — reflecting its inner-city focus. Unit approvals concentrate in inner-city SA2 areas of Sydney and Melbourne, while house approvals spread across outer suburban greenfield zones. This composition shapes where supply pressure is greatest: inner-city renters in Sydney and Melbourne face tight unit markets, while outer suburbs see house-focused development.
Victoria's dominance is striking: 326,854 approvals, representing $146.1B in building value. That's remarkable considering Queensland has a slightly larger population. NSW, Australia's most populous state, trails Victoria by 40,000 dwellings. The Northern Territory has approved fewer homes than a single Melbourne suburb.
This concentration tells us something important: the housing supply problem is not evenly distributed. VIC and NSW account for nearly 58% of all housing approvals. If either state hits a supply constraint—whether labour shortages, builder insolvencies, or financing troubles—the national target becomes even more unachievable.
The Rate Problem: Can Australia Accelerate?
The government's own advisory body, the National Housing Supply and Affordability Council (NHSAC), released sobering figures in May 2025. Their analysis concluded that only 938,000 homes will be completed across the five-year accord period (2024–2029). That's a shortfall of 262,000 dwellings—about 22% below target.
In 2024 alone, Australia completed just 177,000 homes—already 63,000 short of what would be needed to hit the 1.2M target. For the nation to catch up, completions would need to jump from 177,000 to nearly 240,000 per year. But the pipeline is constrained by four major obstacles.
Obstacle 1: The Labour Wall
The most immediate constraint is workers. Australia faces a projected shortfall of 300,000 construction workers by mid-2027 (Infrastructure Australia), with 83,000 workers specifically needed for housing alone. The current trade fill rate stands at just 57%—meaning nearly half of advertised construction jobs go unfilled.
Construction is competing for labour against infrastructure mega-projects (roads, rail, upgrades), all vying for the same pool of electricians, plumbers, carpenters, and heavy equipment operators. Apprenticeships have declined. The workforce is ageing. Until Australia significantly invests in vocational training and can compete globally for construction talent, supply will be limited by the number of workers physically available to build.
Obstacle 2: Builder Insolvencies and Cost Blowouts
Builder collapses have become Australia's new normal. In FY2023-24, approximately 2,832 to 3,217 construction firms became insolvent—accounting for 26–27% of all Australian company failures. At its peak, the equivalent of eight construction businesses collapsed per day.
The trigger was brutal: builders entered fixed-price contracts in 2020–2021 when costs were low, then faced cost blowouts of 30–40% through 2022–2023 as materials, labour, and financing surged. Unable to renegotiate, they either collapsed or stopped accepting new projects. Major builder failures include:
- Porter Davis (2023): 1,700 homes abandoned, $147M in debts
- Probuild (2022): 18 active projects, $250M in debts
- Metricon (2022): Australia's largest house builder, survived only after a $30M emergency injection
When builders collapse, customers lose deposits, projects stall for months or years, and replacement construction costs spike. The result is not just fewer homes being built—it's fewer people willing to commit to buying a new home when builder failure risk is elevated.
Obstacle 3: Cost Inflation and Project Viability
The NHSAC's May 2025 report stated bluntly: "The single biggest constraint on supply currently is that many housing projects are not commercially viable given current land, financing and development costs relative to expected sale prices."
New apartment construction costs jumped 18.2% in 2024-25 nationally. In Queensland, it now costs an average of $708,680 to build a single apartment unit—just the construction cost, not land or developer margin. NSW averages $556,000 per unit; Victoria, $529,000.
At these build costs plus developer finance rates (typically 7–9% for construction loans), many medium- and high-density projects don't stack up. You can't sell an apartment for $650,000 if it costs $710,000 to build. Developers simply don't start the project. The result: fewer approvals being converted to actual construction.
Obstacle 4: Planning System Complexity
Australia's planning system, managed by state and local governments, was never designed for a 240,000-homes-per-year target. The National Planning Reform Blueprint, agreed by National Cabinet, contains 10 separate reform measures—tacit acknowledgment that the current system is failing.
Even well-intentioned reforms are slow to take effect. NSW introduced Transport Oriented Development (TOD) zones in December 2024, streamlining approvals and increasing height/density around transit stations. But uptake to date has been "limited," according to industry observers. Victoria and Queensland have also started reforms, but the pace of change cannot keep up with the urgency of the housing shortage.
What This Means for Property Buyers and Investors
If Australia cannot hit its 1.2M homes target—and the data suggests it won't—several consequences follow for the property market:
- Supply-constrained markets will support prices: In Victoria and Queensland, where approvals are concentrated, tight supply relative to demand will keep price pressure high. Rents will remain elevated as renters outnumber available properties.
- Regional undersupply: States like Tasmania and the NT are building so few homes relative to population that any demand shock (e.g., post-COVID migration reversing) will leave them with empty properties and falling values.
- Yield may outperform growth: In supply-constrained cities, rental yield (the annual rent divided by property price) may deliver better returns than capital growth alone—a shift from the growth-focused investing of the past decade.
- Building costs matter more: As property price volatility becomes less predictable, understanding the true cost of construction—and which suburbs have achievable build costs—will separate savvy investors from those buying on hype.
The Bottom Line
Australia's 1.2 million homes promise is unlikely to be met. The approval pipeline shows we're running at ~184,000 per year when we need 240,000. Completions lag approvals by 1–2 years, and not all approvals convert to finished homes. The government's own body forecasts a 262,000-home shortfall. Labour shortages, builder insolvencies, cost inflation, and planning delays form a vicious cycle with no quick fix.
But that doesn't mean the data is useless. The heatmaps.com.au map shows where the pipeline is strongest—VIC and NSW dominate. It shows which states have barely approved any new homes. And for property investors, understanding the real constraint (it's labour and cost, not regulations alone) helps explain why high-growth suburbs often don't deliver the returns promised, and why looking at approval rates, not just past growth, is critical due diligence.
The promise was ambitious. The reality is that Australia's housing supply challenge runs deeper than any single government policy can fix in five years.
Explore the full ABS building approvals data by state on the heatmaps map.
Open the map →