Latest Articles
Powered by real market data from heatmaps.com.au
Oversupplied Growth Corridors: Not Too Hot, Not Too Bad
Australia's biggest house-building corridors are not automatic traps. Some lag the state market, some track it, and some have strongly outperformed despite heavy new supply.
Read Article
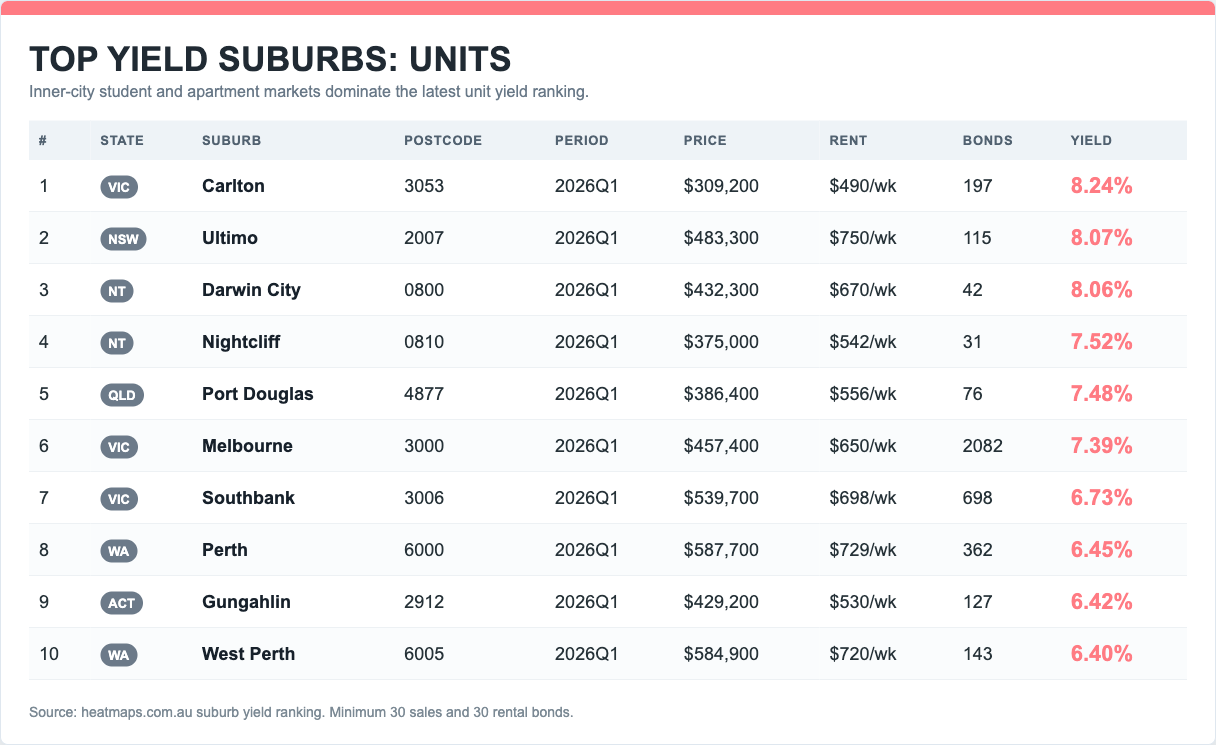
Top Yield Suburbs 2026: Mining Towns, Student Towers and Real Cash Flow
Australia's highest-yielding locations are not one market: resource towns, regional service centres, student apartment precincts, tourism markets and capital-city rental corridors.
Read Article
NSW Property Sales Data: Public, Powerful and Painfully Messy
NSW sales data is public, but it arrives as ZIP-packed DAT files full of duplicates, bulk transactions, bad dates, noisy dwelling types and extreme prices. Here is what it takes to make it usable.
Read Article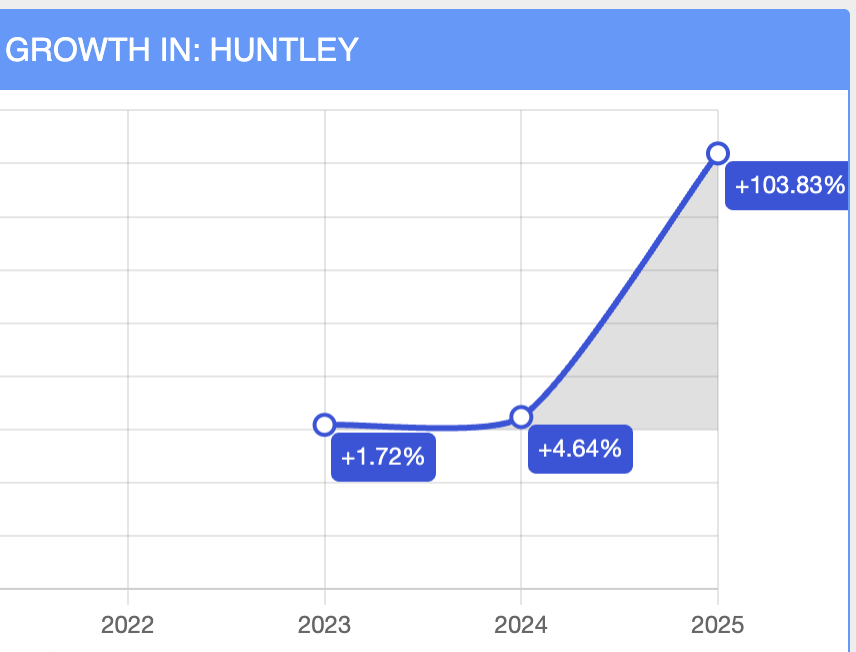
Top Growth Suburbs 2025: When 103% Means Nothing — and When 42% Means Everything
We ranked Australia's top 10 highest-growth suburbs against real-world evidence. Some headline figures are statistical illusions from new estates. Others are backed by mining projects, floods, and cotton booms.
Read Article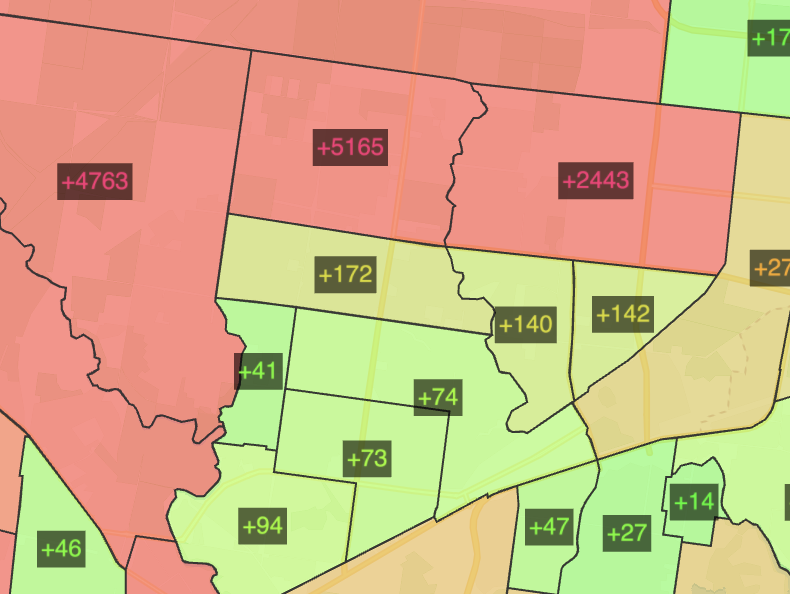
Where Australia's New Homes Are Being Built: Development Hotspots 2020–2026
Which Australian suburbs and regions have seen the most residential building approvals since June 2020? A state-by-state breakdown of the nation's hottest development corridors, from Melbourne's western fringe to Queensland's Ripley Valley.
Read Article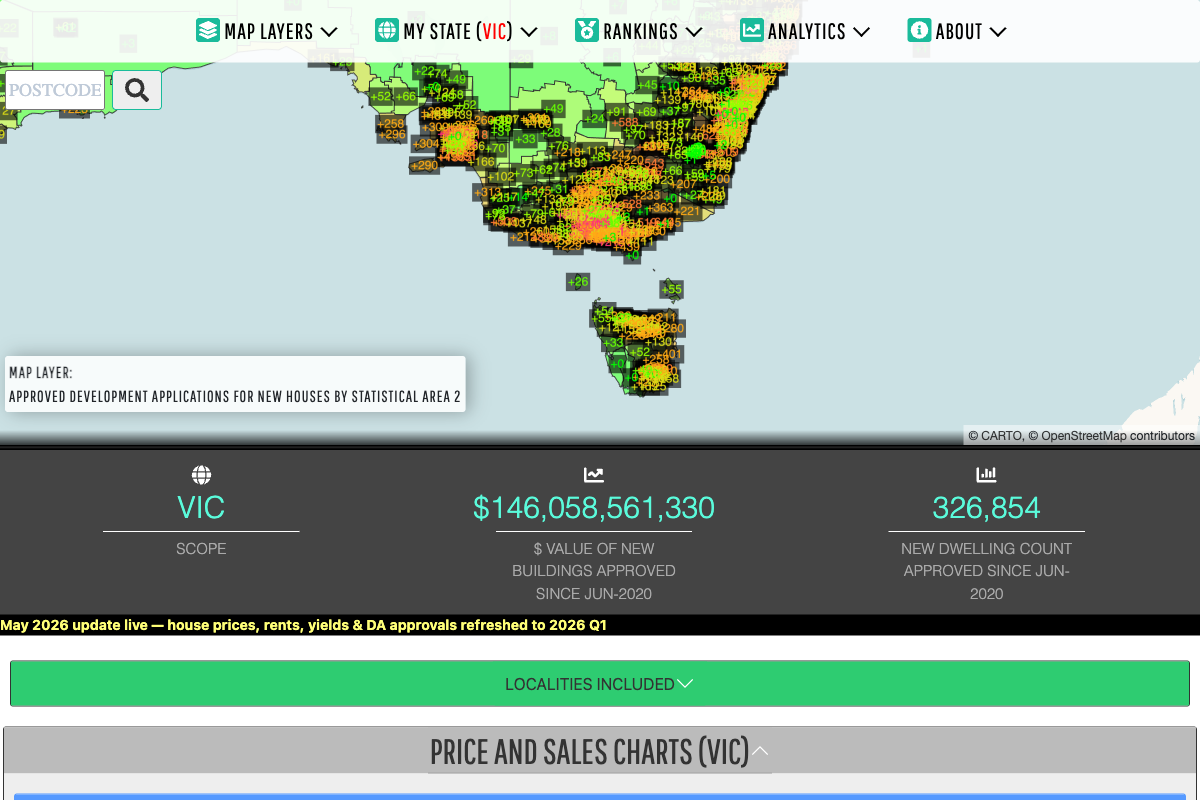
1.2 Million Homes by 2029: What the ABS Data Actually Shows
Australia approved 1,056,669 new dwellings since June 2020 — still short of what the government needs in just the next five years. We mapped the gap, state by state.
Read ArticleGet the Full Picture
Read these insights in detail on the interactive map. Explore live data layers, zoom into your suburb, and discover what's really happening in Australian property right now.
Open the Map