Yield rankings look simple: divide annual rent by purchase price, sort descending, and admire the cash flow. But the interesting part is never the formula. It is the question behind the number: why is this suburb producing that yield?
We rebuilt the top-yield suburb rankings using suburb-level rents and prices, a minimum of 30 new rental bonds, and the latest available period for each state. That matters. A suburb with five rental records can look spectacular by accident. A suburb with 100 rental bonds, 70 sales and a yield above 7% deserves a closer look.
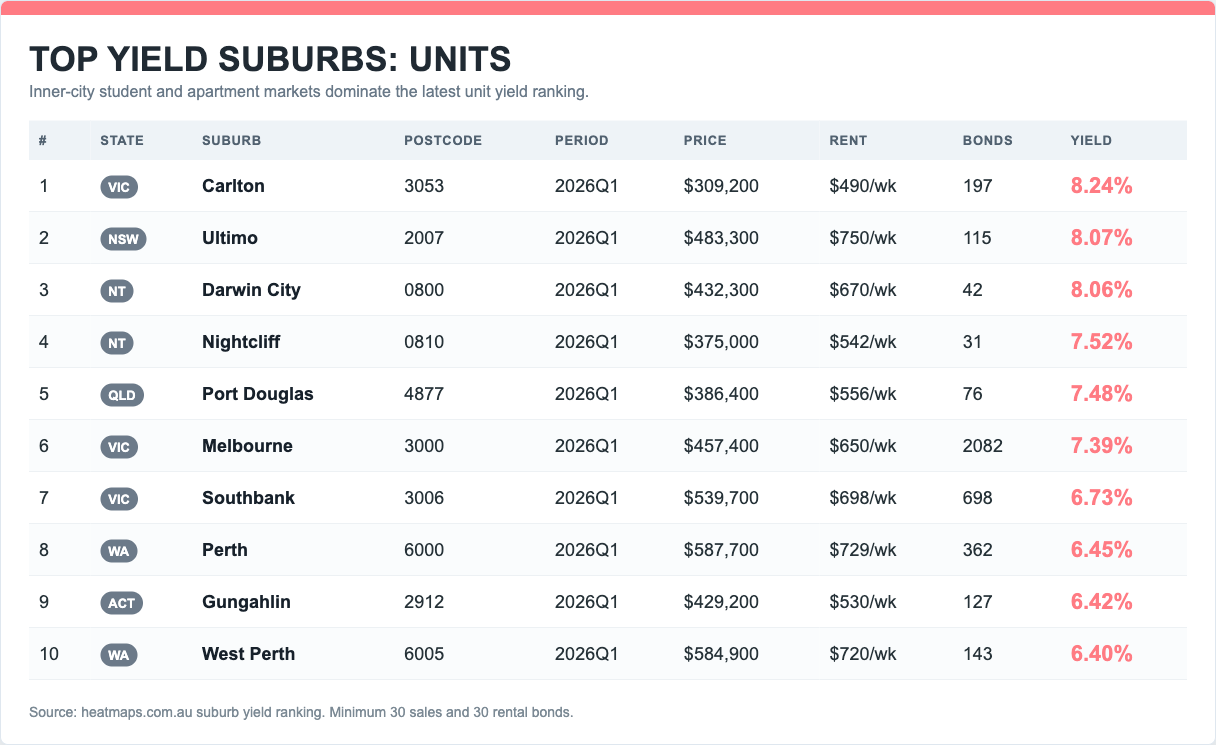
Unit yield leader: Carlton VIC at 8.24% in 2026Q1.
Ranking filter: suburb-level records with at least 30 new rental bonds registered.
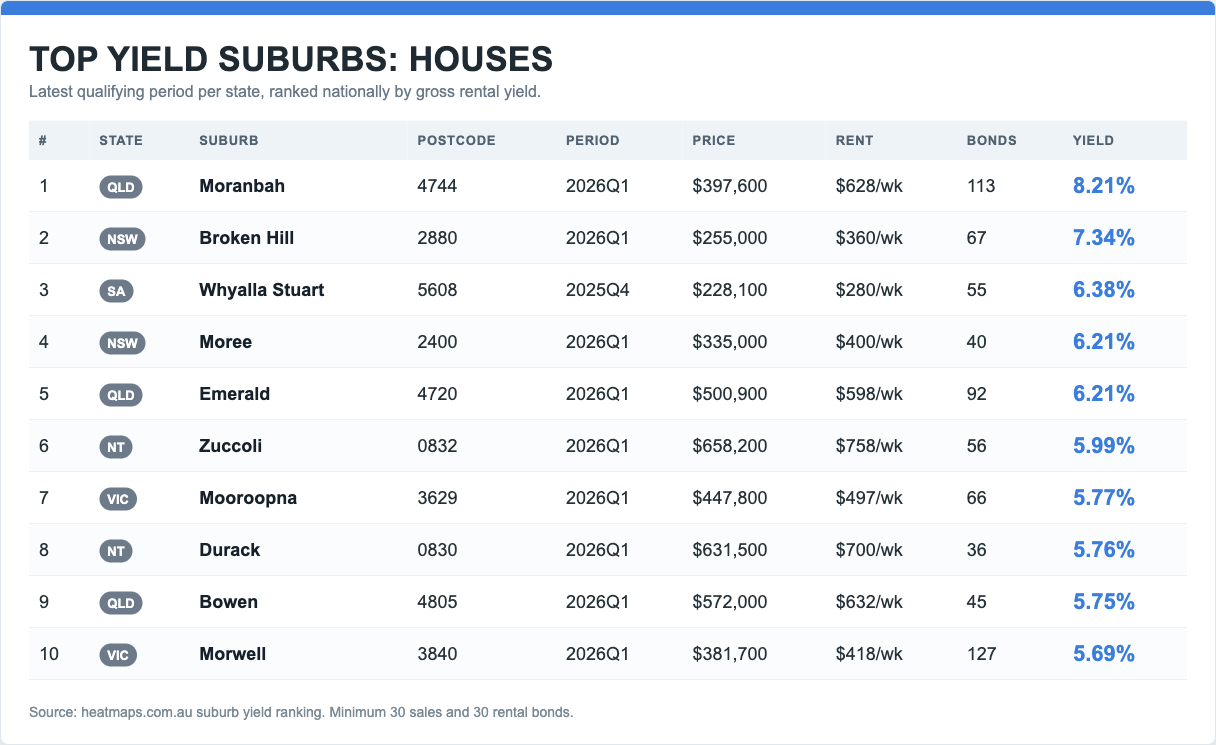
The House Ranking: Cash Flow Still Lives Outside the Capitals
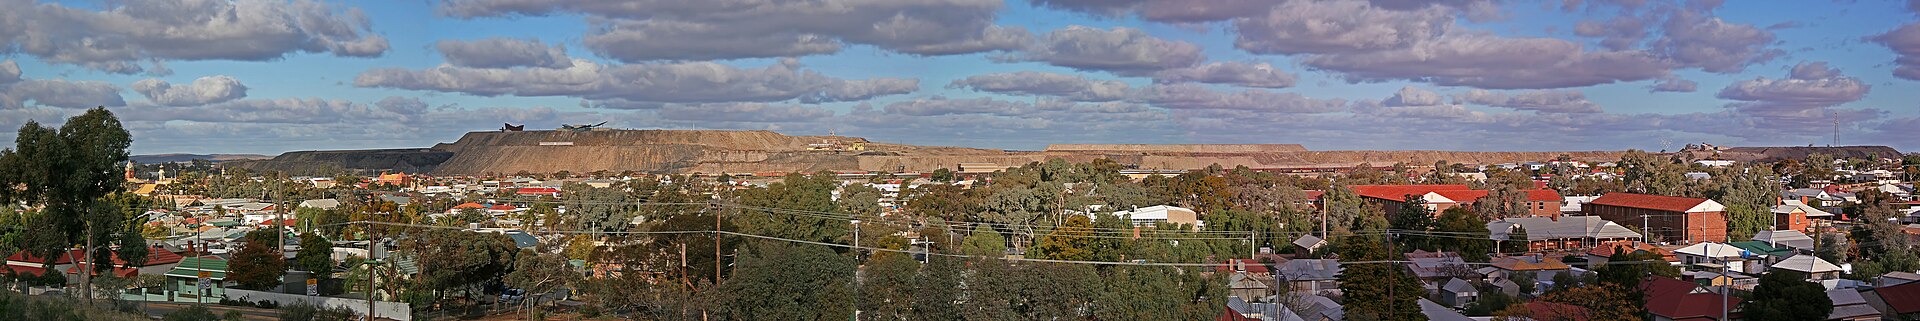
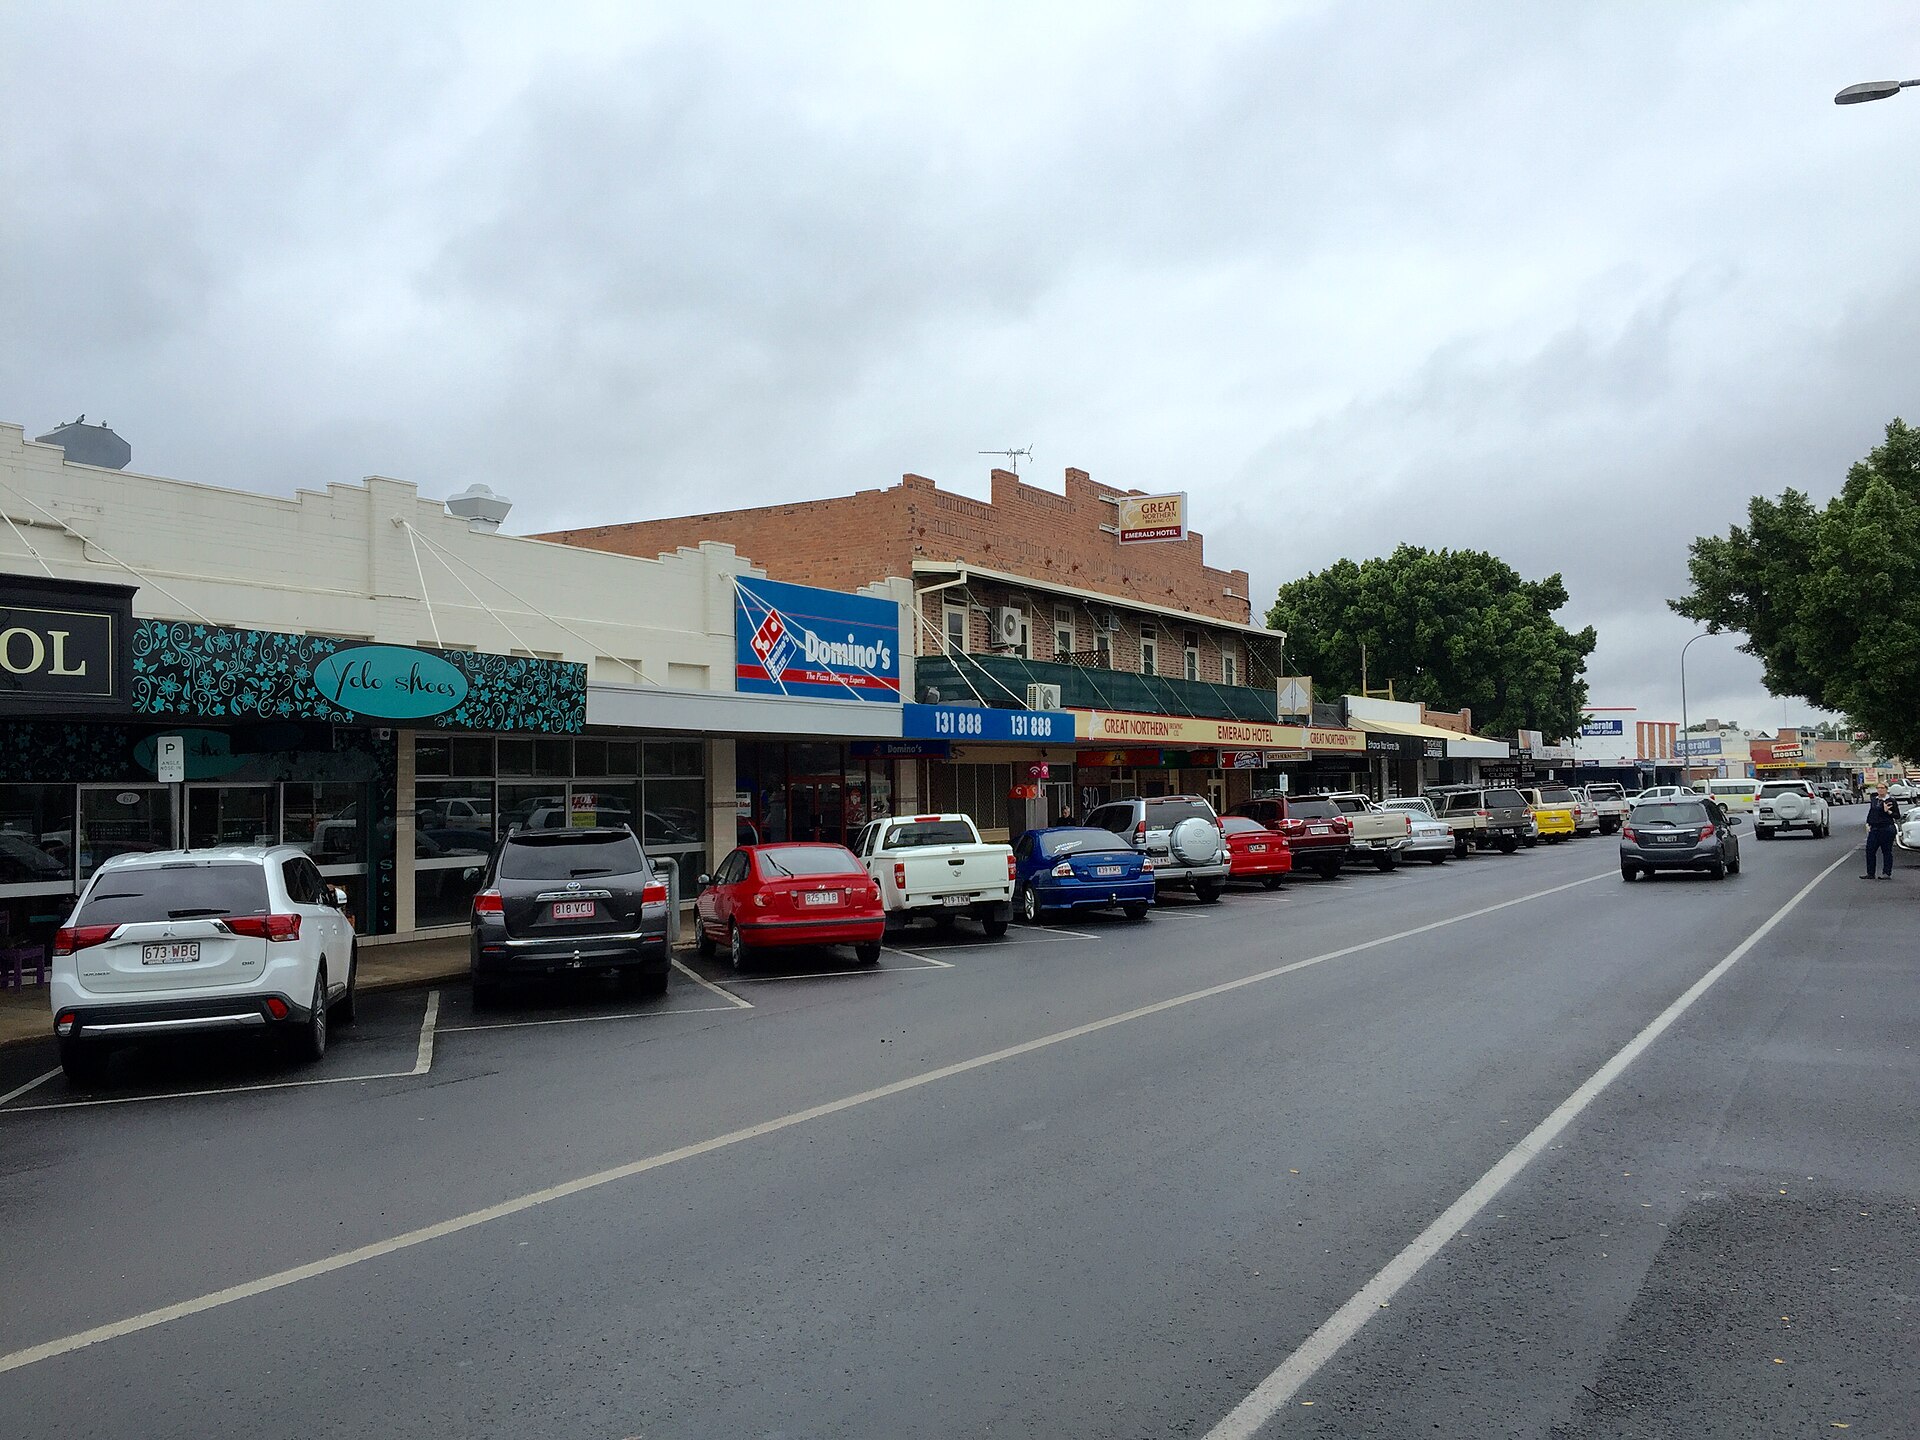
The top house yields are not random. They cluster in resource towns, affordable regional service centres, and smaller markets where weekly rents are high relative to still-modest house prices. Moranbah, Broken Hill, Whyalla Stuart, Moree and Emerald all sit above 6% gross yield. That is a very different story from inner Sydney or inner Melbourne, where the rent is high but the price base is usually much higher.
CASH-FLOW ENGINE Resource and Industrial Towns
Moranbah is the clearest example. The median house price is $397,600, median rent is $628 per week, and there were 113 new rental bonds in the period. That produces an 8.21% gross yield. This is the classic resource-town equation: worker demand can push rents up quickly, while prices remain anchored by the market's cyclical risk.
The same broad pattern appears in Emerald, Bowen, Broken Hill, Whyalla Stuart, Morwell and Muswellbrook. These are not identical markets, but they share a basic structure: local employment drivers, rental demand from workers, and a purchase price base that is still well below the major capitals. That is why the yield can look so powerful.

The caution is obvious but important: high yield is not the same thing as low risk. Resource-town demand can be tied to a small number of employers, projects or commodity cycles. A great rent today can become a long vacancy tomorrow if the local economy turns. The ranking is a signal to research, not a green light to buy blind.
STEADIER YIELD Regional Service Centres
A second group is less dramatic: Mooroopna, Maryborough, Kingaroy, Benalla, Horsham, Shepparton, Bairnsdale, Sale, Wangaratta, Warrnambool, Mildura, Parkes, Gympie and Devonport. Their yields are generally in the high-4% to high-5% range, which is lower than Moranbah but often supported by broader local economies.
These are places where the rent-price relationship is doing quiet work. The towns usually have hospitals, schools, retail, agriculture, public services or regional industry. They may not deliver the sharpest headline yield, but they can be less dependent on a single mine or project.
The Unit Ranking: The Yield Story Moves Back to the City
The unit ranking is completely different. Here the top suburbs are not mostly regional towns. They are inner-city apartment markets, student precincts, tourism markets and compact capital-city rental corridors. Carlton, Ultimo, Darwin City, Nightcliff, Port Douglas, Melbourne, Southbank, Perth, Gungahlin and West Perth dominate the top 10.
REAL BUT SPECIALIST Student and Micro-Apartment Markets
Carlton leads the unit ranking at 8.24%. Melbourne, Southbank, West Melbourne, North Melbourne, Footscray, Box Hill and Docklands also appear in the top group. These markets have deep tenant pools, especially around universities, hospitals, transport and CBD employment.
Ultimo is the best example of a number that looks suspicious until you inspect the sales. A $750 per week median unit rent looks plausible for inner Sydney. A $483,300 median unit price looks low. But the sales table shows why: since the start of 2025, there were 227 unit sales in Ultimo, including 71 below $300,000. Several recent sales at 185 Broadway were tiny student-accommodation-style units, with prices around $132,000 to $225,000. So the yield is not automatically a data glitch. It is a stock-mix warning.
That distinction matters. A micro-apartment or student accommodation unit can be a legitimate high-yield asset, but it is not interchangeable with a standard one-bedroom apartment. Finance, resale depth, body corporate costs, short-stay rules and use restrictions can all change the real return.
HIGH RENT PRESSURE Darwin, Perth, Canberra and Tourism Units
Darwin City and Nightcliff both sit above 7.5% gross yield for units. Perth, West Perth, East Perth and Rivervale sit around 6% to 6.5%. Gungahlin, Belconnen, City, Bruce, Phillip and Dickson show that Canberra apartments can also rank strongly when prices are contained and rents remain firm.

Port Douglas is another specialist case. Its 7.48% unit yield is not the same kind of market as Carlton or Ultimo. Tourism and lifestyle demand can support high rents, but those markets can be seasonal and more exposed to body corporate costs, holiday letting rules and insurance.

So Which Yields Are Trustworthy?
The ranking is strongest when the yield is backed by three things: enough sales, enough rental bonds, and an explainable local story. Moranbah has 113 rental bonds. Carlton has 197. Melbourne has 2,082. Ultimo has 115. These are not one-record accidents.
But there are still traps. Gross yield ignores vacancy, maintenance, strata fees, land tax, insurance, management costs and finance costs. It also treats all properties in a suburb as if they are comparable. They are not. In a suburb like Ultimo, the median unit price can be pulled down by very small student units. In a mining town, the median rent can be pulled up by worker demand that may not last forever.
The Real Lesson
The highest-yielding locations in Australia are not one market. They are several different markets wearing the same percentage sign. Moranbah's 8.21% house yield is a resource-town story. Carlton's 8.24% unit yield is an inner-city student and compact-apartment story. Darwin City is a high-rent capital-city market. Port Douglas is a tourism-market warning label. Mooroopna and Horsham are regional affordability stories.
That is why yield data is powerful only when it is paired with context. A high yield can reveal an opportunity. It can also reveal a risk premium. The job is to work out which one you are looking at.
Explore Top Yield Suburbs on the Map