For years, these were the places where the city kept spreading: fresh estates, new streets, cranes and a steady procession of homes moving from plan to approval. Then the paperwork began to thin out.
The national headline gives no warning. Australia averaged about 49,610 approvals per quarter in early 2026—6.1% above the longer historical norm. Yet underneath that encouraging number, some of the country's busiest growth regions were slowing sharply.
This is not a list built from tiny towns or one-off apartment towers. Every region had historically approved at least 100 homes per quarter, and we compared 2026 with its full earlier record—not merely with one unusually busy quarter.
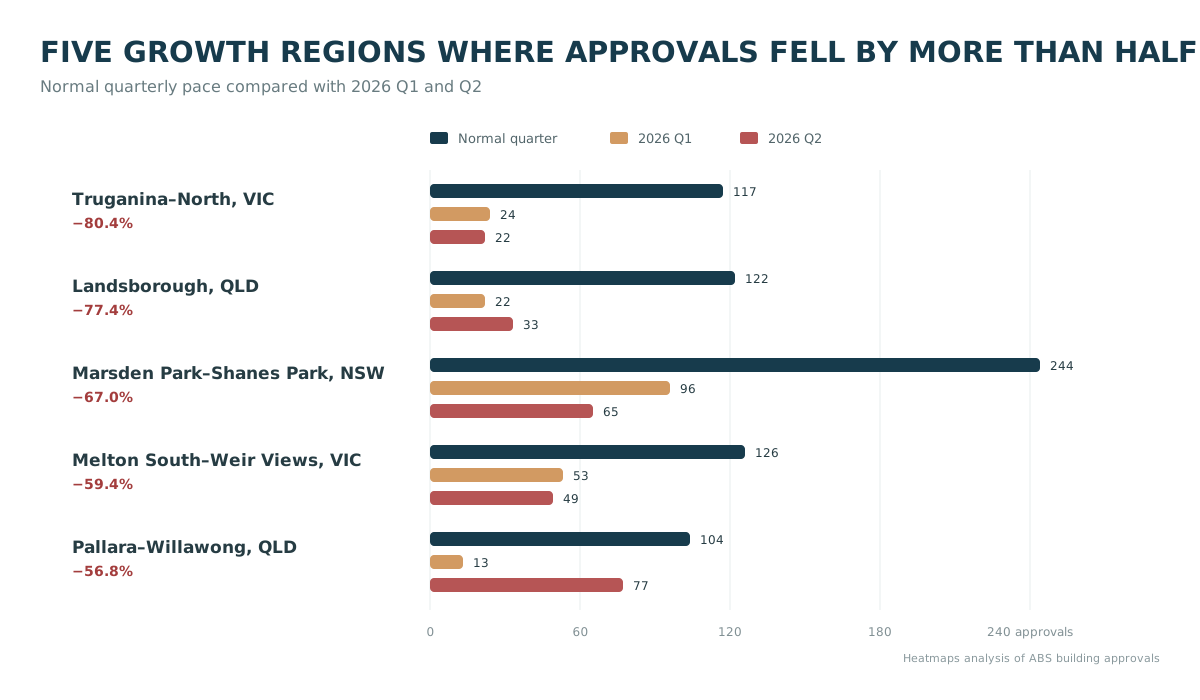
The five places where the pipeline went quiet
| SA2 region | Historical avg. | 2026 Q1 | 2026 Q2 | 2026 avg. change |
|---|---|---|---|---|
| 1Truganina–North, VIC | 117 | 24 | 22 | −80.4% |
| 2Landsborough, QLD | 122 | 22 | 33 | −77.4% |
| 3Marsden Park–Shanes Park, NSW | 244 | 96 | 65 | −67.0% |
| 4Melton South–Weir Views, VIC | 126 | 53 | 49 | −59.4% |
| 5Pallara–Willawong, QLD | 104 | 13 | 77 | −56.8% |
These figures describe building approvals, not construction commencements or completed homes. They tell us where permission for new dwellings has slowed. They do not, by themselves, tell us why.
1Truganina–North, Victoria−80.4%
A growth corridor that suddenly stopped growing at its old pace
Truganina–North used to add approvals with the regularity of a production line. Across the earlier five and a half years, around 117 new homes were approved in a normal quarter. Then the flow almost vanished: just 24 in Q1 2026 and 22 in Q2.
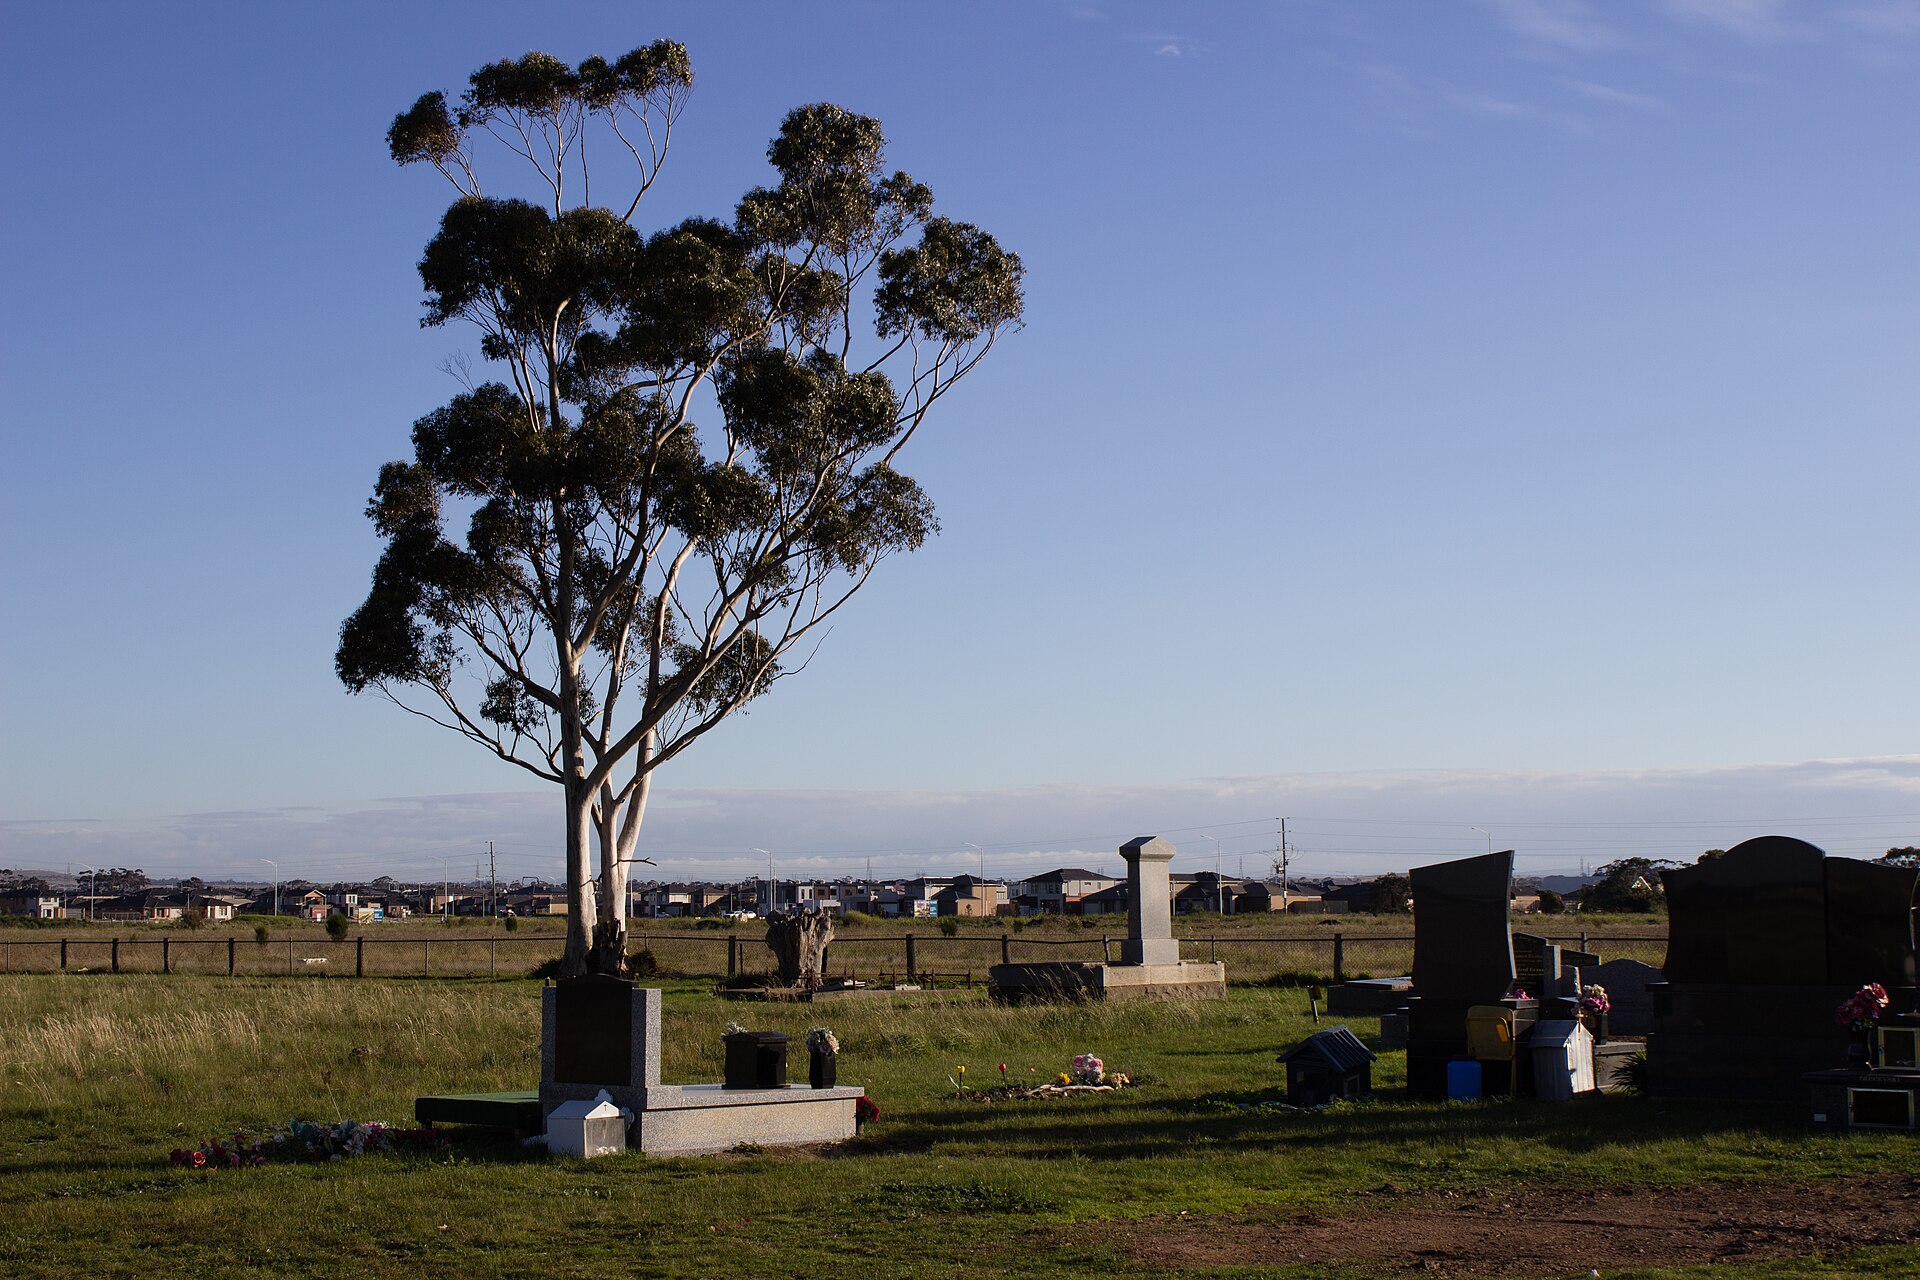

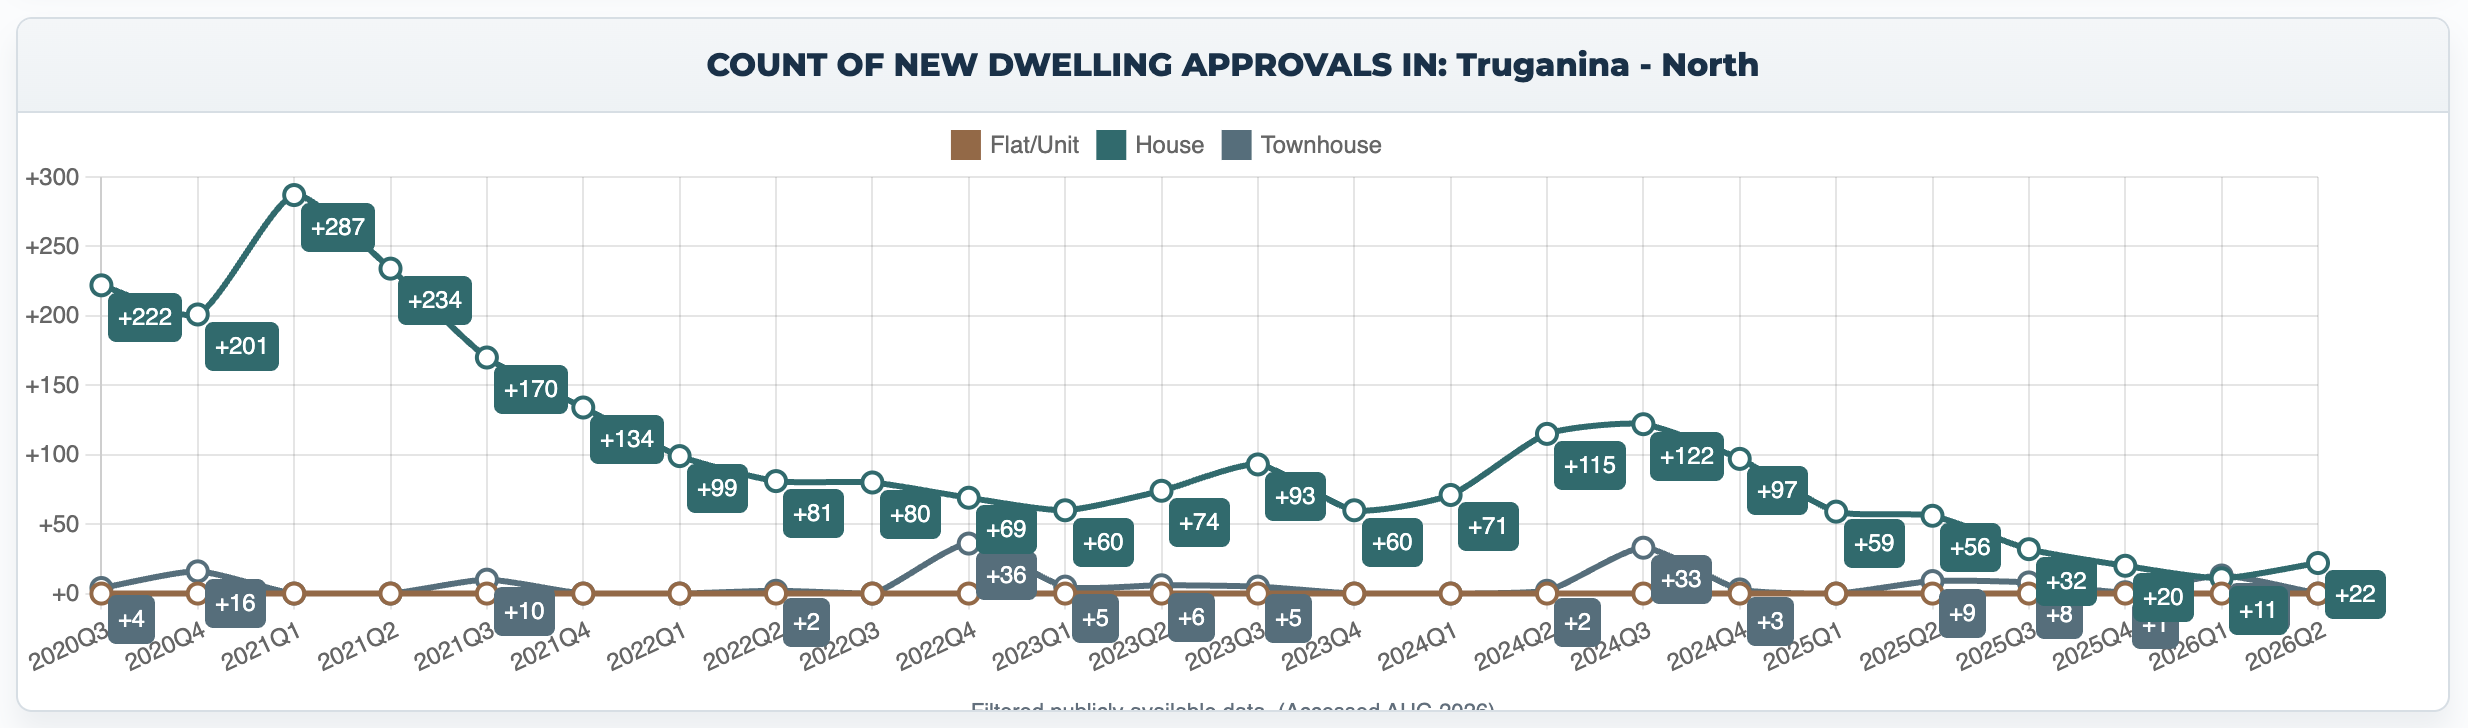
This is overwhelmingly a house story. The area once averaged about 111 house approvals each quarter; early 2026 averaged only 16.5. It is not merely one unlucky quarter either—the long sequence has been losing momentum for years.
For local residents
Fewer new estates may mean less immediate construction disruption and fewer extra cars arriving at once.
For property owners
A thinner future supply pipeline can reduce competition, although it may also signal weaker development economics or demand.
2Landsborough, Queensland−77.4%
From a busy hinterland pipeline to only a few dozen approvals
Landsborough, Palmview, Mooloolah Valley, Glenview, Mount Mellum and Diamond Valley collectively averaged around 122 approvals per quarter. The latest results were only 22 and 33—a dramatic change for a region accustomed to steady new-house growth.
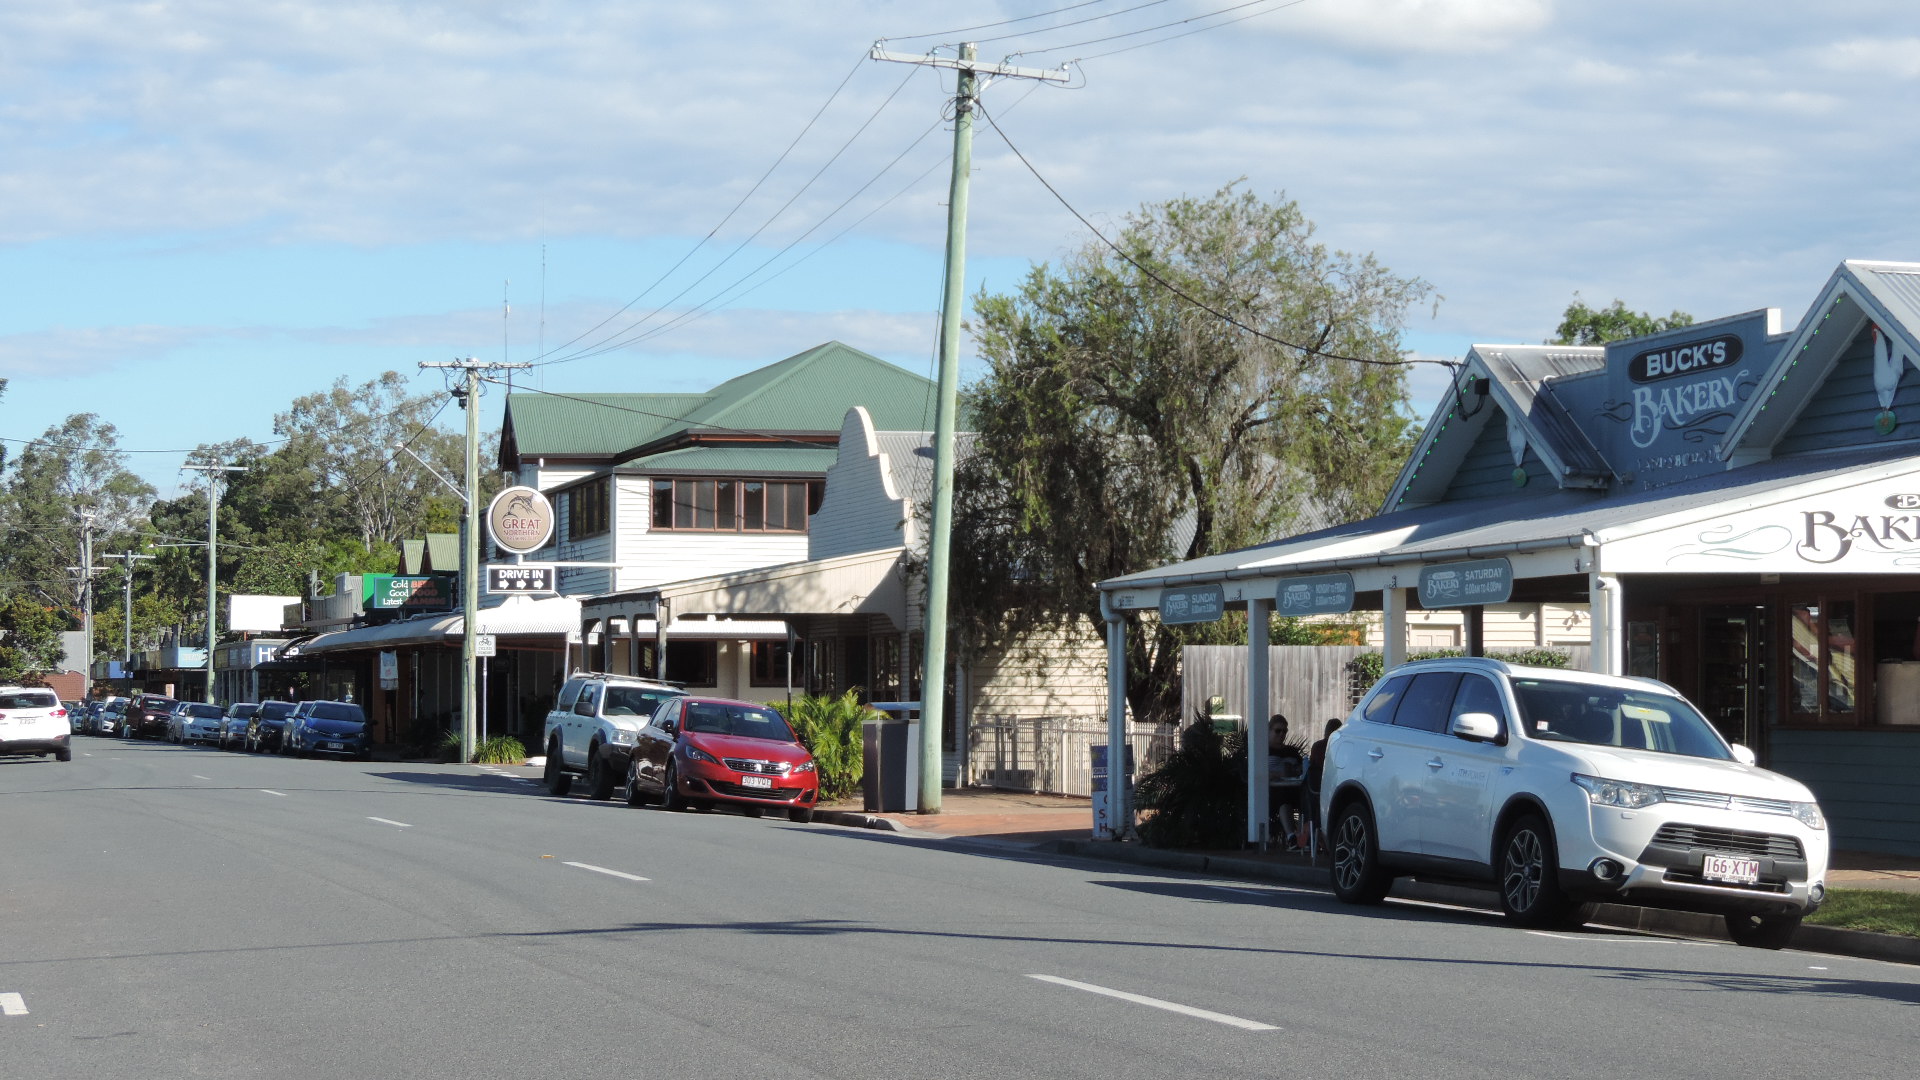

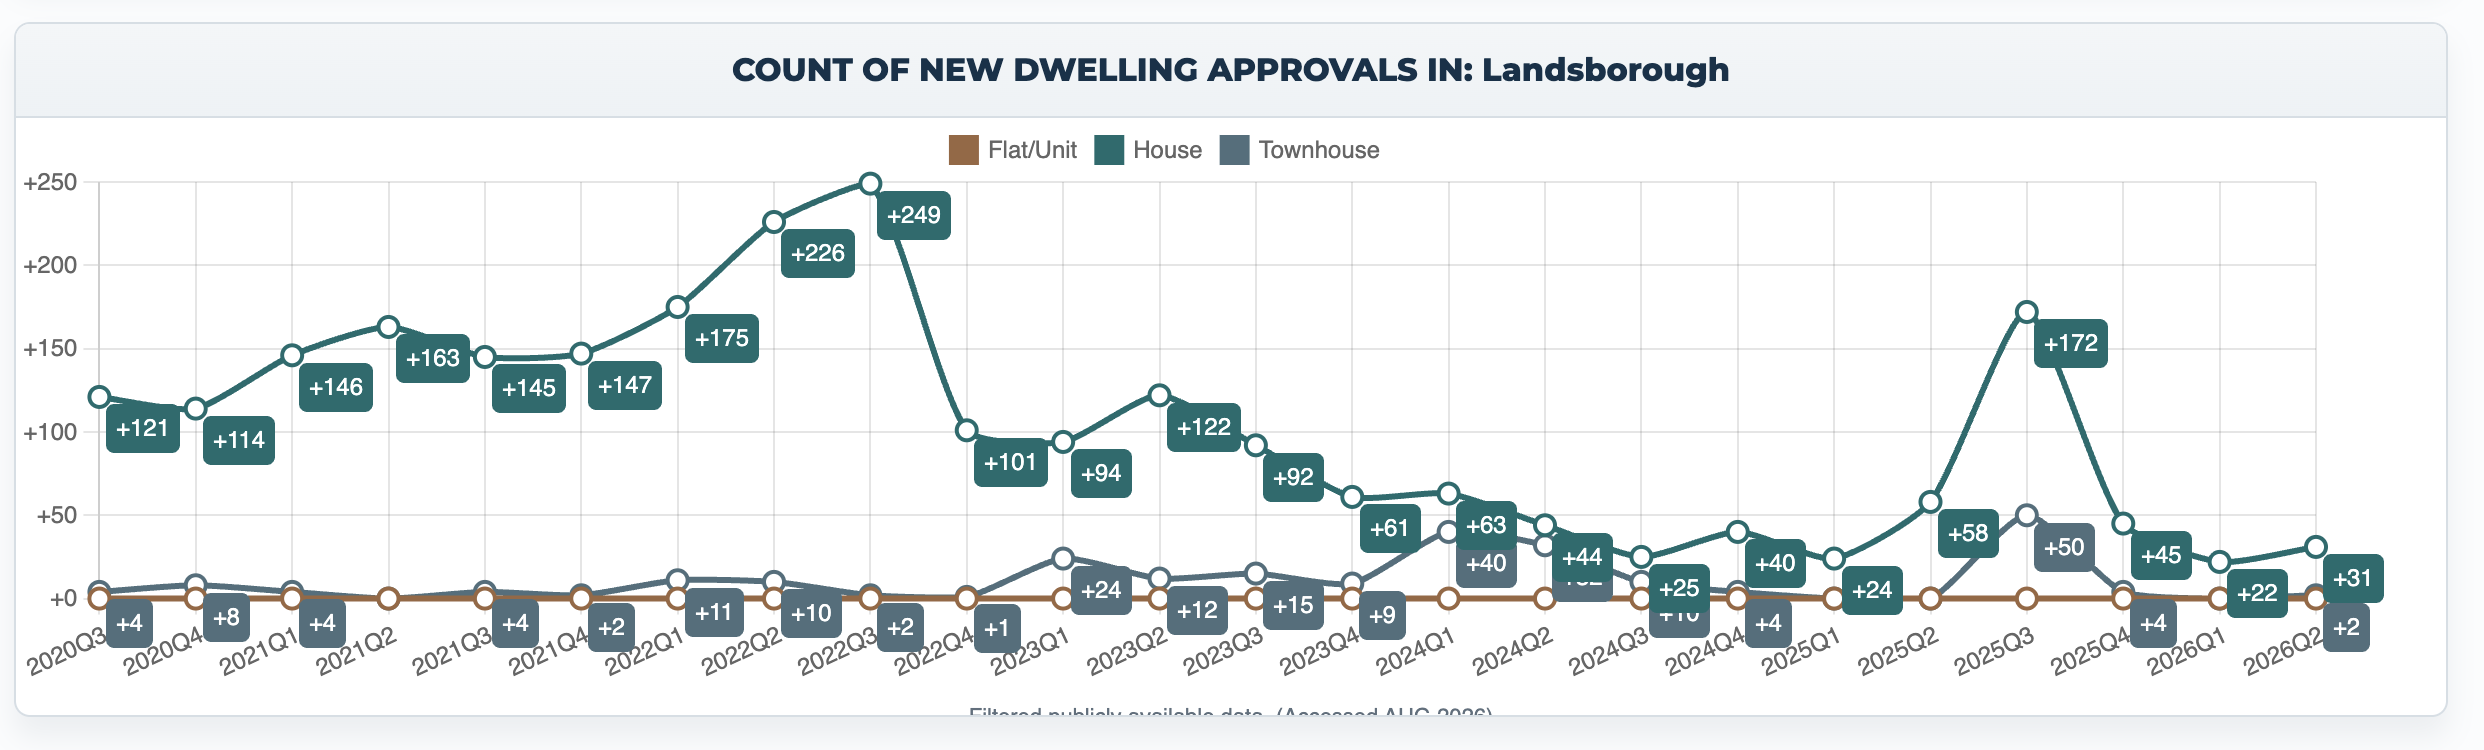
Normally, houses dominate here. That old pace—about 110 houses and 11 townhouses a quarter—fell to an average of only 26.5 houses and one townhouse in early 2026. Even after smoothing out earlier spikes, the fall remains unmistakable.
The quieter side
Less building activity may temporarily ease pressure from trucks, roadworks and the rapid conversion of semi-rural land.
The unanswered question
Scarcity can support established homes, but falling approvals alone cannot tell us whether land, demand, finance or feasibility caused the slowdown.
3Marsden Park–Shanes Park, NSW−67.0%
The biggest missing pipeline: about 163 fewer homes every quarter
Marsden Park, Melonba and Shanes Park formed the largest historical approval market in this group. A normal quarter brought around 244 approvals. In 2026 that fell to 96, then 65.
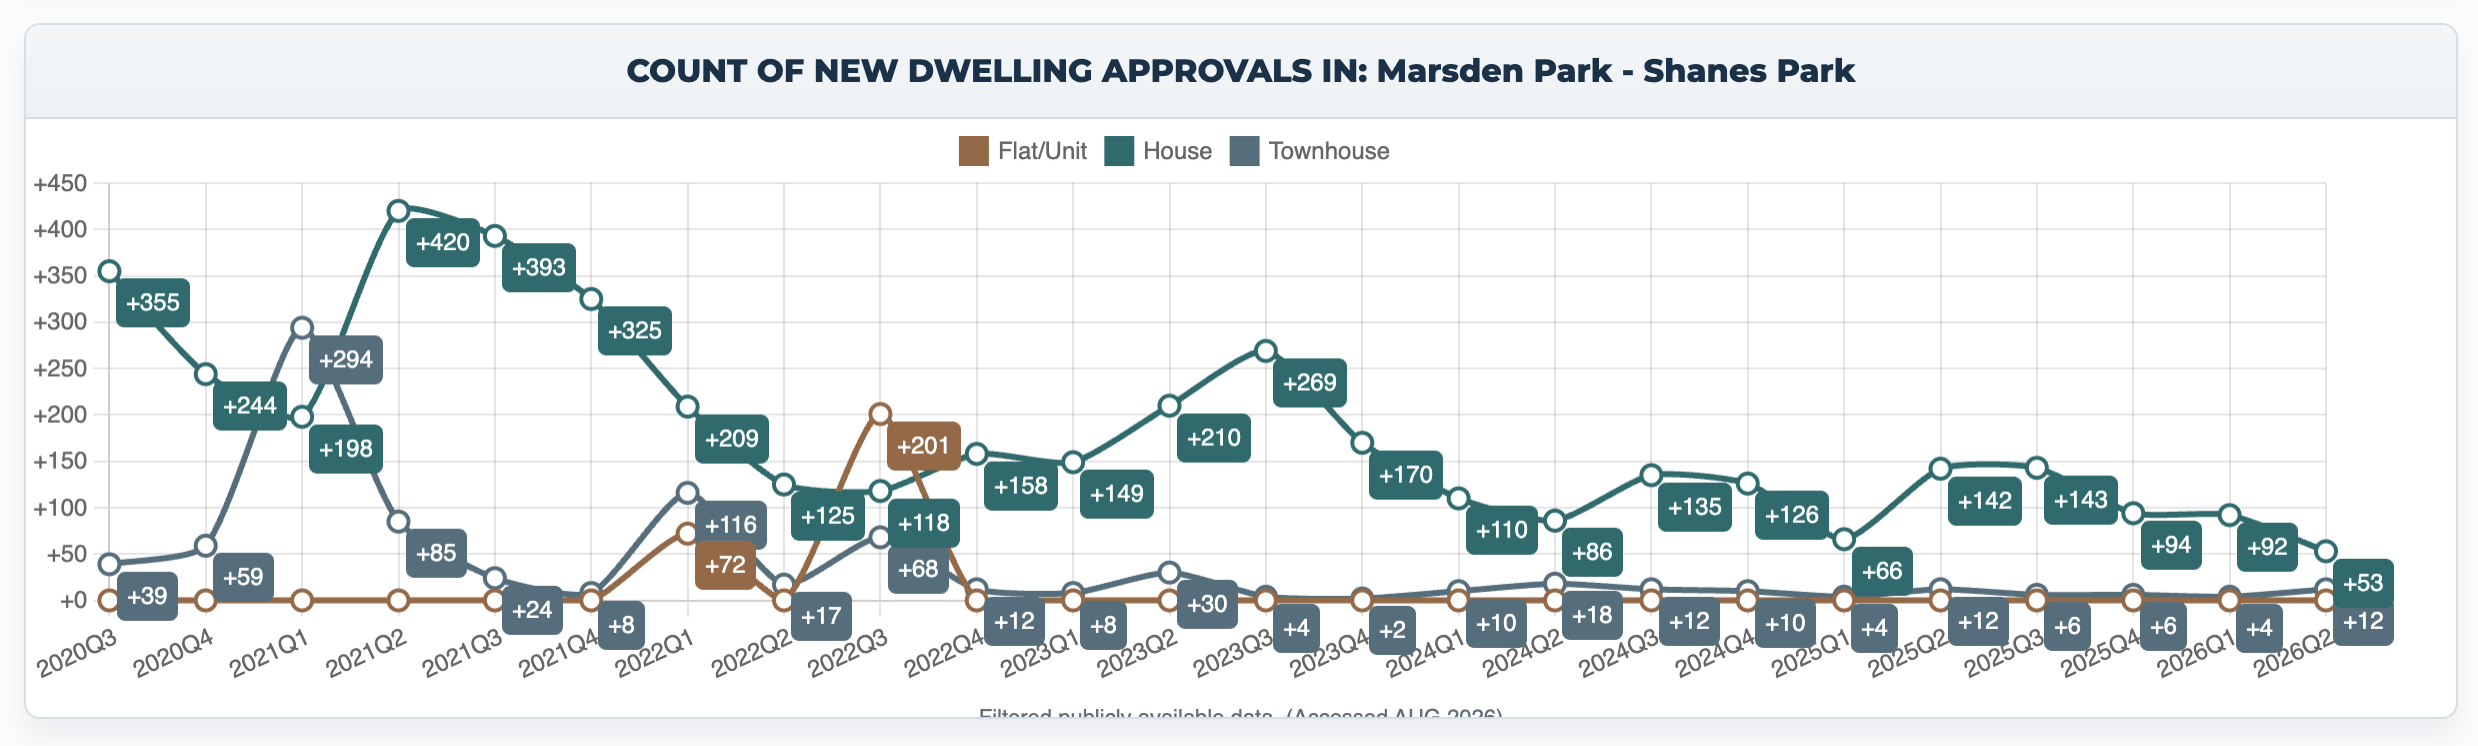
That is the largest missing volume in the top five: roughly 163 fewer homes per quarter than normal. Houses fell from about 193 a quarter to 72.5, while townhouses fell from around 38 to eight. The region is still expanding—but at roughly one-third of its familiar speed.
What neighbours may notice
The endless edge of new streets may advance more slowly, easing the sense that local infrastructure is always chasing population growth.
What owners may watch
Established homes face fewer incoming competitors, but slower development can also postpone the shops, schools and services that growing populations attract.
4Melton South–Weir Views, Victoria−59.4%
Not a one-quarter wobble: two quiet quarters in a row
Melton South–Weir Views usually averaged around 126 approvals per quarter. The first two quarters of 2026 produced only 53 and 49.

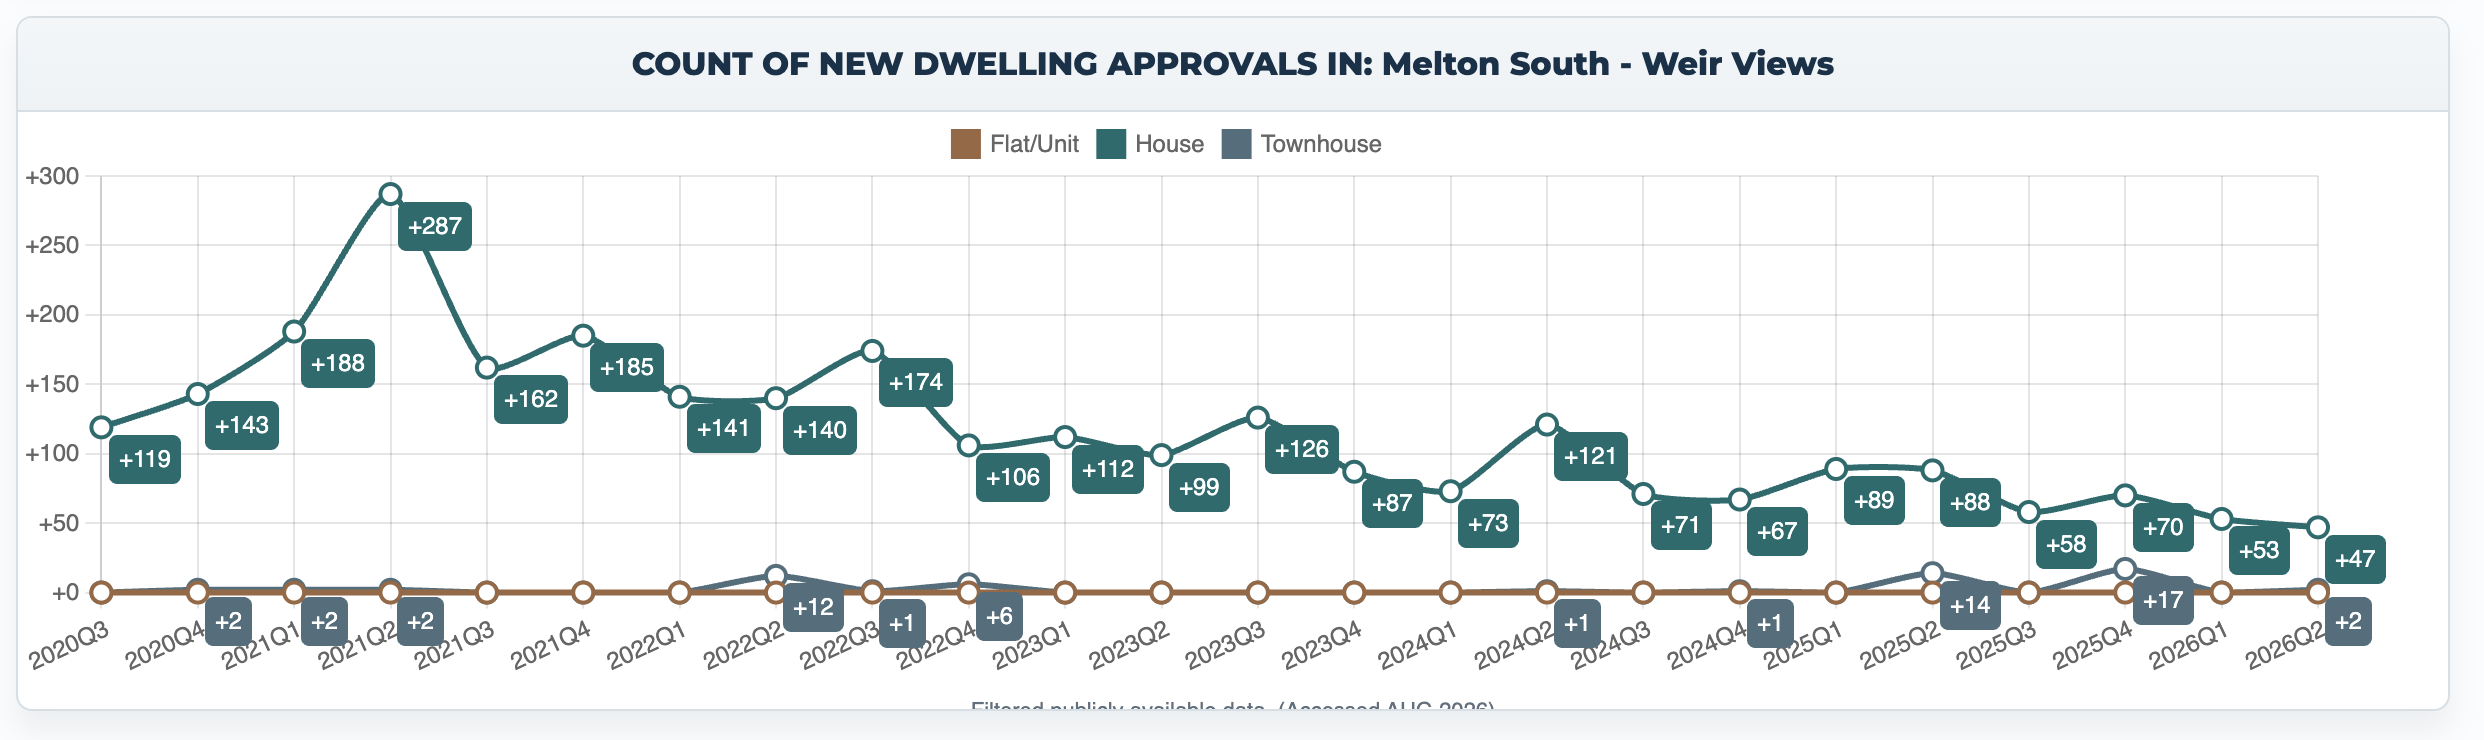
The near-identical results make this one of the clearest slowdowns. There is no single freak quarter doing the work: new housing simply continued at a pace about 60% below the region's longer history.
A pause from rapid change
Two quieter quarters can mean fewer building sites and a slower arrival of pressure on roads, schools and local services.
A scarcity story—with limits
Lower approvals may reduce future competition, but it should not be mistaken for proof that prices or rents must rise.
5Pallara–Willawong, Queensland−56.8%
The pipeline nearly stopped—then began to breathe again
Pallara–Willawong normally averaged around 104 dwelling approvals per quarter. It recorded just 13 in Q1 2026 before recovering to 77 in Q2.

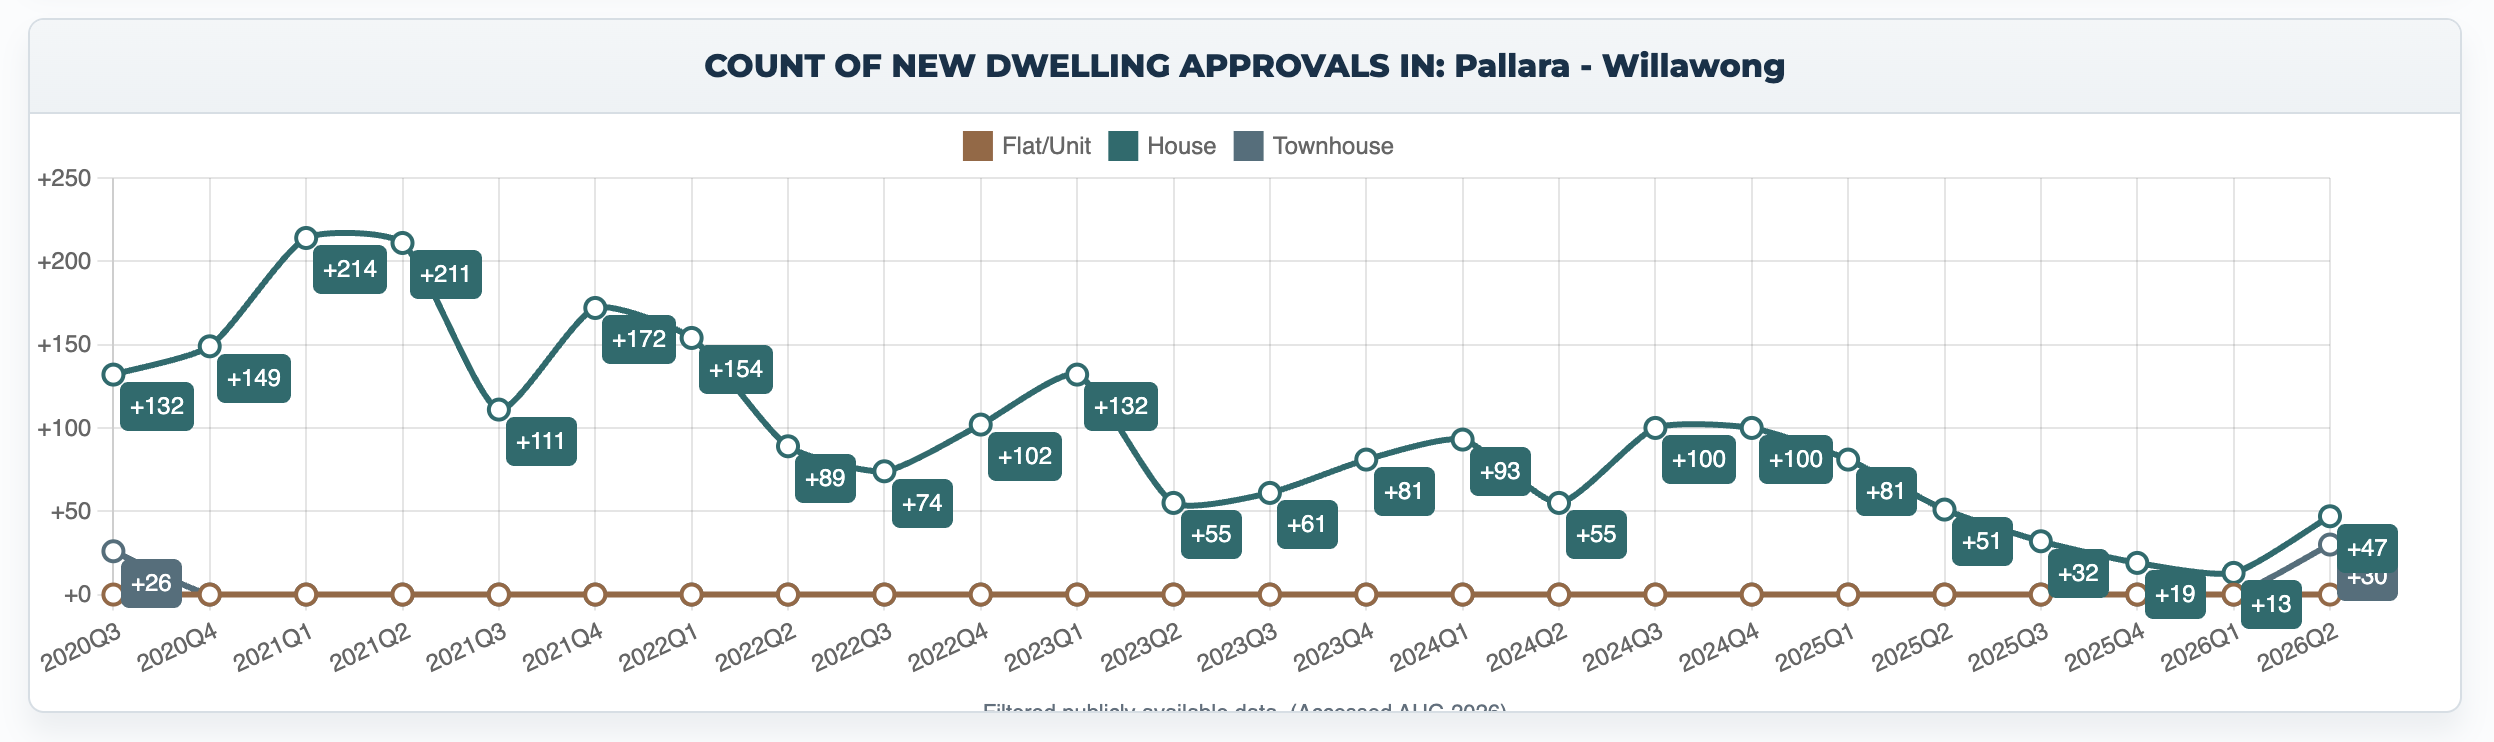
This is the least uniform decline in the group. The second quarter was still below normal, but the rebound matters. Pallara–Willawong may be experiencing a pause rather than the deeper retreat visible in Truganina–North.
The lived experience
Q1 would have felt exceptionally quiet for a growth area; Q2 suggests builders and releases may not have disappeared for long.
The caution
Do not turn a two-quarter fall into a permanent scarcity claim. This region is already showing why the latest quarter must be read separately.
When the bulldozers go quiet, the story is not automatically good—or bad
Existing owners may welcome fewer competing homes, less dust and a slower strain on local roads. But a fading pipeline can also mean fewer new shops, delayed infrastructure, weaker buyer demand or projects that no longer make financial sense. We know that approvals fell. The data alone cannot tell us why.
How we found the five
- Scale: each SA2 had to average at least 100 dwelling approvals per quarter.
- Long baseline: the historical average covers every complete quarter from 2020 Q3 to 2025 Q4—not only the immediately preceding period.
- Recent comparison: 2026 Q1 and Q2 are shown separately, with their average used to calculate the percentage decline.
- Stability: highly irregular apartment markets dominated by isolated tower approvals were excluded.
- Material decline: the latest average had to be more than 50% below the historical average.
SA2s are statistical regions and can contain several suburbs. An approval is permission to build, not proof that construction has started or will finish.
The national headline concealed the local reversal
Australia approved more homes overall in early 2026. Yet in Truganina–North, the recent pace was roughly one-fifth of normal. In Marsden Park–Shanes Park, around 163 approvals disappeared from an average quarter. Those are not abstract percentage changes; they represent entire streets and stages that are no longer entering the pipeline at their familiar speed.
Source: Heatmaps analysis of ABS Building Approvals, SA2 monthly data. General information only; not financial advice.
Explore Building Approvals