You wake up, make a coffee and see the headline: “House prices in your suburb have fallen.”
If you own a home there, your stomach drops. If you are hoping to buy, you may feel a rush of excitement. But before either reaction takes over, there is one important question to ask:
Which homes actually sold?
Perhaps the beautiful, expensive homes stayed firmly off the market. Their owners were in no hurry to sell. Meanwhile, smaller and more affordable homes kept changing hands at close to their usual pace. The suburb’s reported median could fall sharply even though neither group of homes became cheaper.
The number is not fake. But without the story behind it, it can leave buyers, sellers and homeowners with completely the wrong impression.
A Home Is Not a Tonne of Wheat
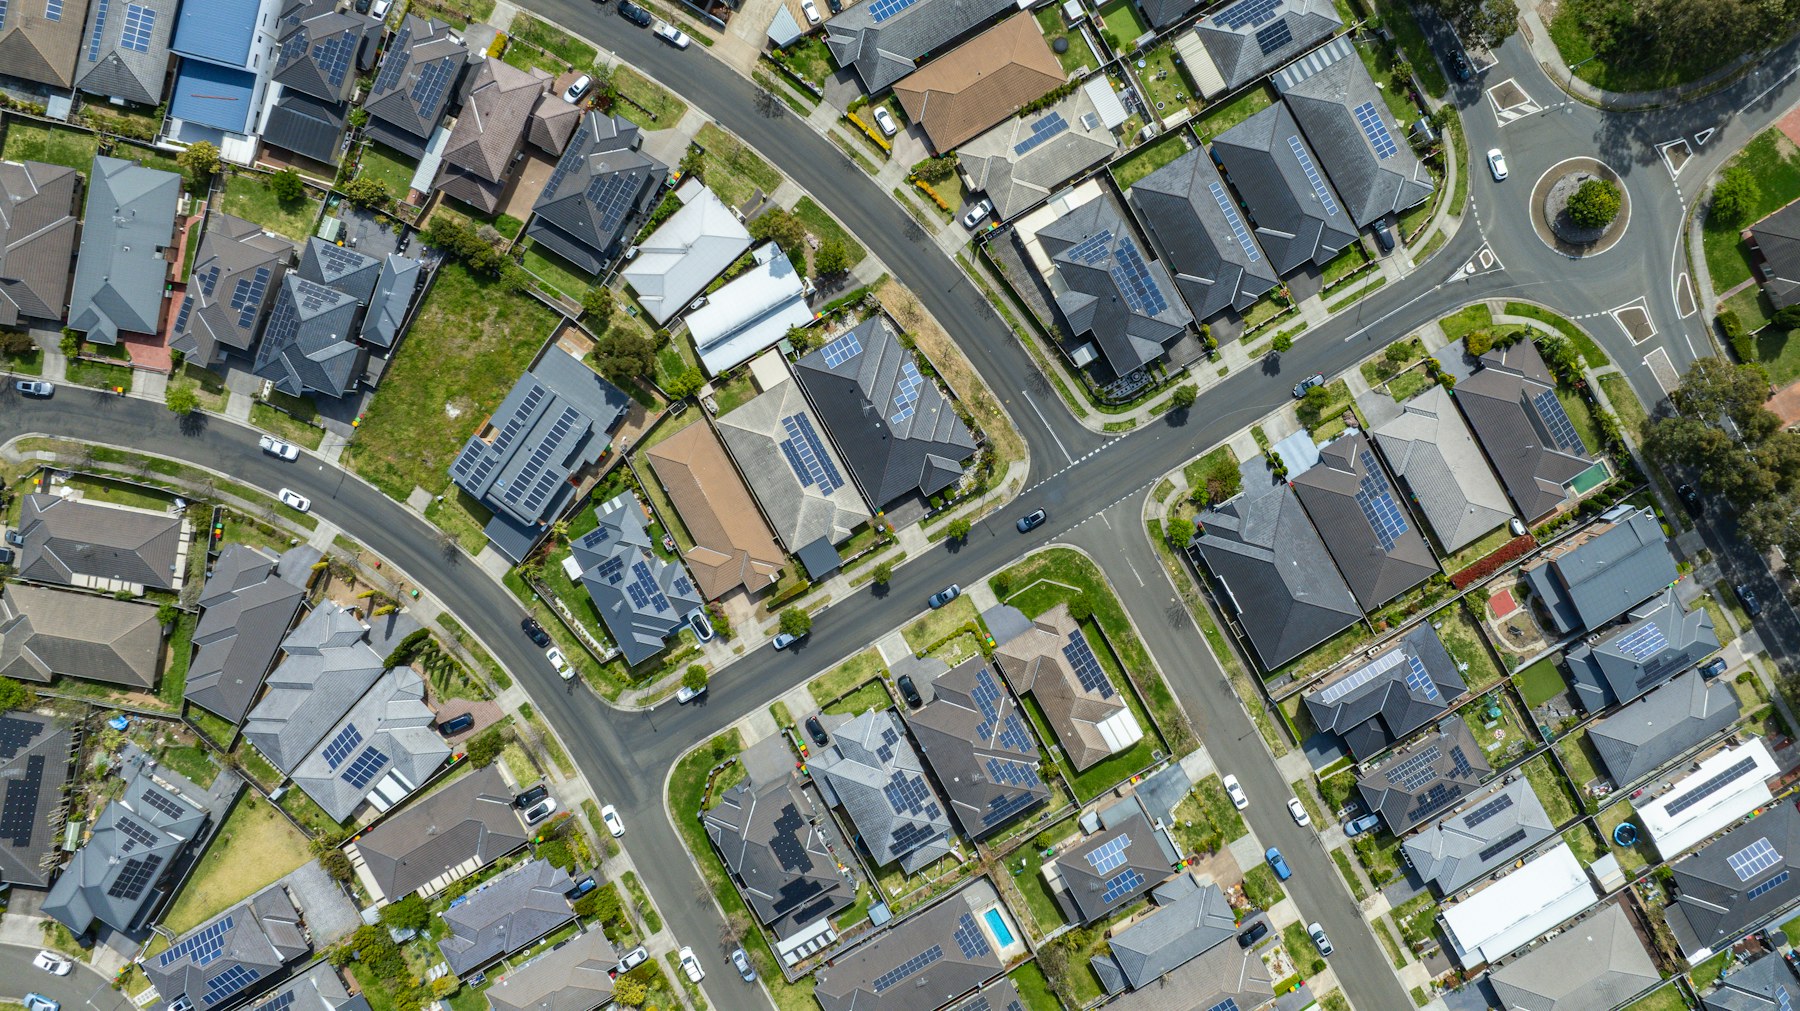
Property prices are unusually difficult to measure because homes are not standard products.
One tonne of the same grade of wheat should be much like another tonne. A barrel of a particular type of oil can be traded as a standard commodity. But there is only one home on your exact block of land, facing your direction, on your part of the street.
Even two houses that look identical in a spreadsheet — three bedrooms, two bathrooms, one garage and the same land size — can feel completely different when you walk through the front door. One may have morning light, a peaceful garden and a beautiful renovation. The other may face a busy road, need major repairs or back onto a noisy site.
Then there are the human details. One seller needs a quick result. Another refuses to accept anything below a dream price. One auction has two determined families bidding against each other. Another happens on a rainy weekend with almost nobody there.
All of that ends up in the sale price. A database sees numbers. Buyers experience a home.
How a “40% Fall” Can Happen Without Prices Falling
Imagine a very small suburb with just two kinds of homes. The more affordable homes sell for $600,000. The premium homes sell for $1.4 million.
In the first period, five of each type sell. The median is $1 million. In the next period, the affordable homes keep selling, but premium owners stay put. Five affordable homes sell and only one premium home changes hands.
| Period | Affordable sales | Premium sales | Price within each segment | Reported median |
|---|---|---|---|---|
| A | 5 | 5 | Unchanged | $1,000,000 |
| B | 5 | 1 | Unchanged | $600,000 |
The new median is $600,000 — a dramatic 40% fall. Yet the affordable homes are still worth $600,000 and the premium homes are still worth $1.4 million. Not one like-for-like price has changed.
What changed was the cast of characters, not the price of their homes.
Real suburbs are much messier than this simple example. Prices and the mix of sales can move at the same time. But the lesson is the same: a median can tell you what sold without telling you exactly what happened to the value of a typical home.
And the Average Can Be Tricked Too
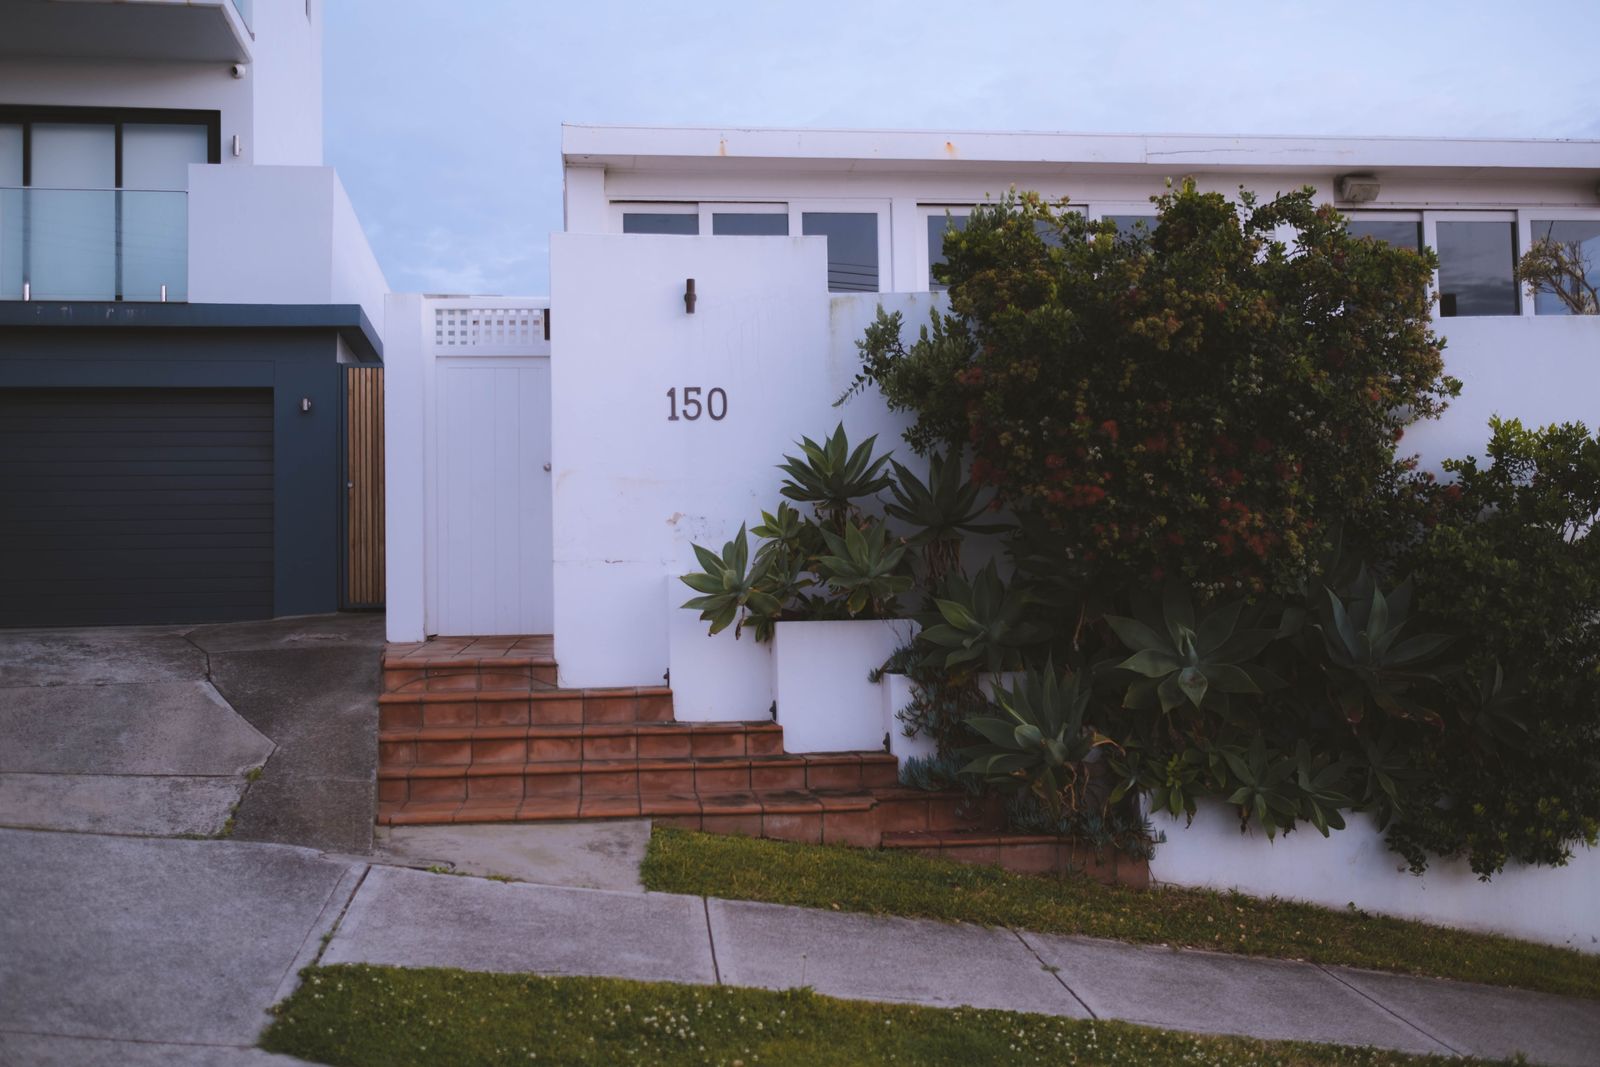
An average has a different weakness. Add one $8 million waterfront sale to a quiet month and the suburb average may jump. That does not mean every ordinary home suddenly became more valuable.
Neither the median nor the average is useless. Both are helpful snapshots. The danger comes when a snapshot is presented as the whole movie.
So What Is a Hedonic Price Index?
The name sounds intimidating. The idea is not.
A hedonic price index tries to compare like with like. Instead of throwing every sale into one bucket, it accounts for the features that usually influence price — such as location, property type, land size, bedrooms, bathrooms, parking and age.
In plain English, it asks:
Suppose mostly two-bedroom units sold last month and mostly three-bedroom houses sold this month. A raw median may show a huge rise. A hedonic index tries to recognise that the market did not necessarily surge — we may simply be looking at larger, more expensive properties.
Think of it as a careful buyer comparing recent sales. They would not compare a renovated family home on a quiet street with a tired unit beside a highway and call the difference “market growth”. A hedonic model tries to make that common-sense adjustment across thousands of sales.
Smarter Does Not Mean Perfect
No formula can walk through a front door and feel the afternoon sun. A dataset may know that a property has four bedrooms, but not that one is tiny. It may know the land size, but not that the garden feels private and peaceful. Renovations, views, street noise, floor plans and the emotion of an auction can be difficult to record.
A hedonic index is usually a better tool for tracking like-for-like market movement, particularly when the mix of sales is changing. But it is still an estimate built from imperfect information. It should guide judgement, not replace it.
| Number you see | What it can tell you | What to remember |
|---|---|---|
| Median price | The middle sale in that period | It changes when a different mix of homes sells |
| Average price | The total value of sales divided by the number sold | A few very expensive sales can pull it higher |
| Mix-adjusted index | Compares more consistent groups of homes | It only adjusts for the groups it was given |
| Hedonic index | Tries to compare homes of similar quality | It cannot account for features the data does not capture |
| Repeat-sales index | Compares a property with its own earlier sale | The home may have been renovated between sales |
What Should an Everyday Buyer or Owner Look At?
There is no single number you should trust blindly. When sales are slowing — especially at the expensive end — look for a fuller picture:
- Check how many homes sold. A big change based on ten sales deserves more caution than the same change based on 300.
- Separate houses from units. Combining them can hide two very different stories.
- Look at what actually sold. Were they renovated family homes, small units, development sites or distressed sales?
- Compare similar homes. Recent nearby sales that genuinely resemble the property are often more useful than one suburb-wide number.
- Look at several periods. One unusual month can be noise. A pattern lasting several quarters deserves more attention.
- Use more than one measure. If the median and a quality-adjusted index disagree, that is a clue to investigate rather than choose the more exciting headline.
A Headline Is the Beginning, Not the Answer
Property data matters because homes are emotional. For many people, a home is their largest asset, their biggest debt and the place where much of life happens. A dramatic headline can influence whether someone buys, sells, waits or worries.
That is why the details behind the number matter. Medians are useful. Averages are useful. Hedonic indices are useful. None of them can tell the entire story alone.
The fairest reading combines transaction numbers, the kinds of homes being sold, quality-adjusted price movements and genuinely comparable recent sales. It also leaves room for something every homeowner already knows: a house is not just a collection of bedrooms and square metres.
Further reading: Reserve Bank of Australia, Measuring Housing Prices; RBA comparison of hedonic and repeat-sales measures; and ABS residential property price index methodology. This article is general information, not financial advice.
Read About Property Data Cleaning